

Most education-fund projections make the same quiet mistake: they aim at today’s price tag. A programme that costs $88,000 today does not cost $88,000 in twelve years — and a fund aimed at the wrong target can “succeed” all the way to a shortfall. This projector prices the target in enrolment-year dollars, projects the fund year by year with the grant matching included, and prints the gap between them without flinching.
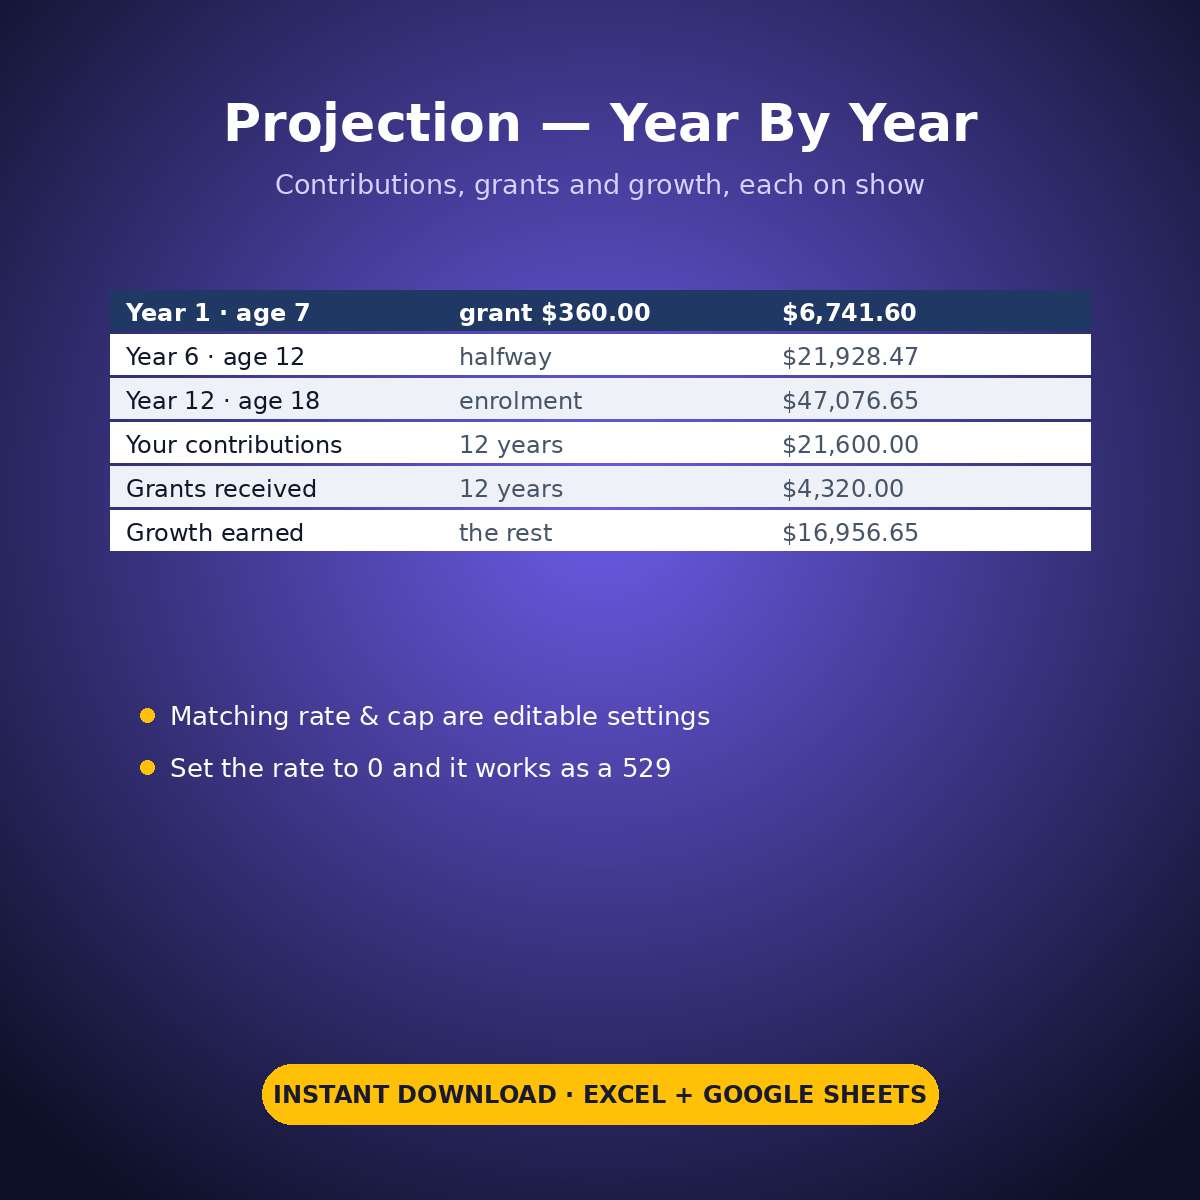
The sample: a child of 6, enrolling at 18. $4,200 already saved, $150 a month going in, an EXAMPLE 6% return. The matching grant is modelled as an editable EXAMPLE setting — pre-filled CESG-style at 20% of contributions capped at $500 a year (the published Canada Education Savings Grant figures, with a verify-and-replace note; US 529 users set the rate to 0 and the sheet works unchanged). At $150 a month the grant adds $360 a year.
Twelve visible rows later the fund lands at $47,076.65: your $21,600 of contributions, $4,320 of grants, $16,956.65 of growth. Every year is auditable — contributions, grant, growth, balance — with no FV() black box anywhere in the file.
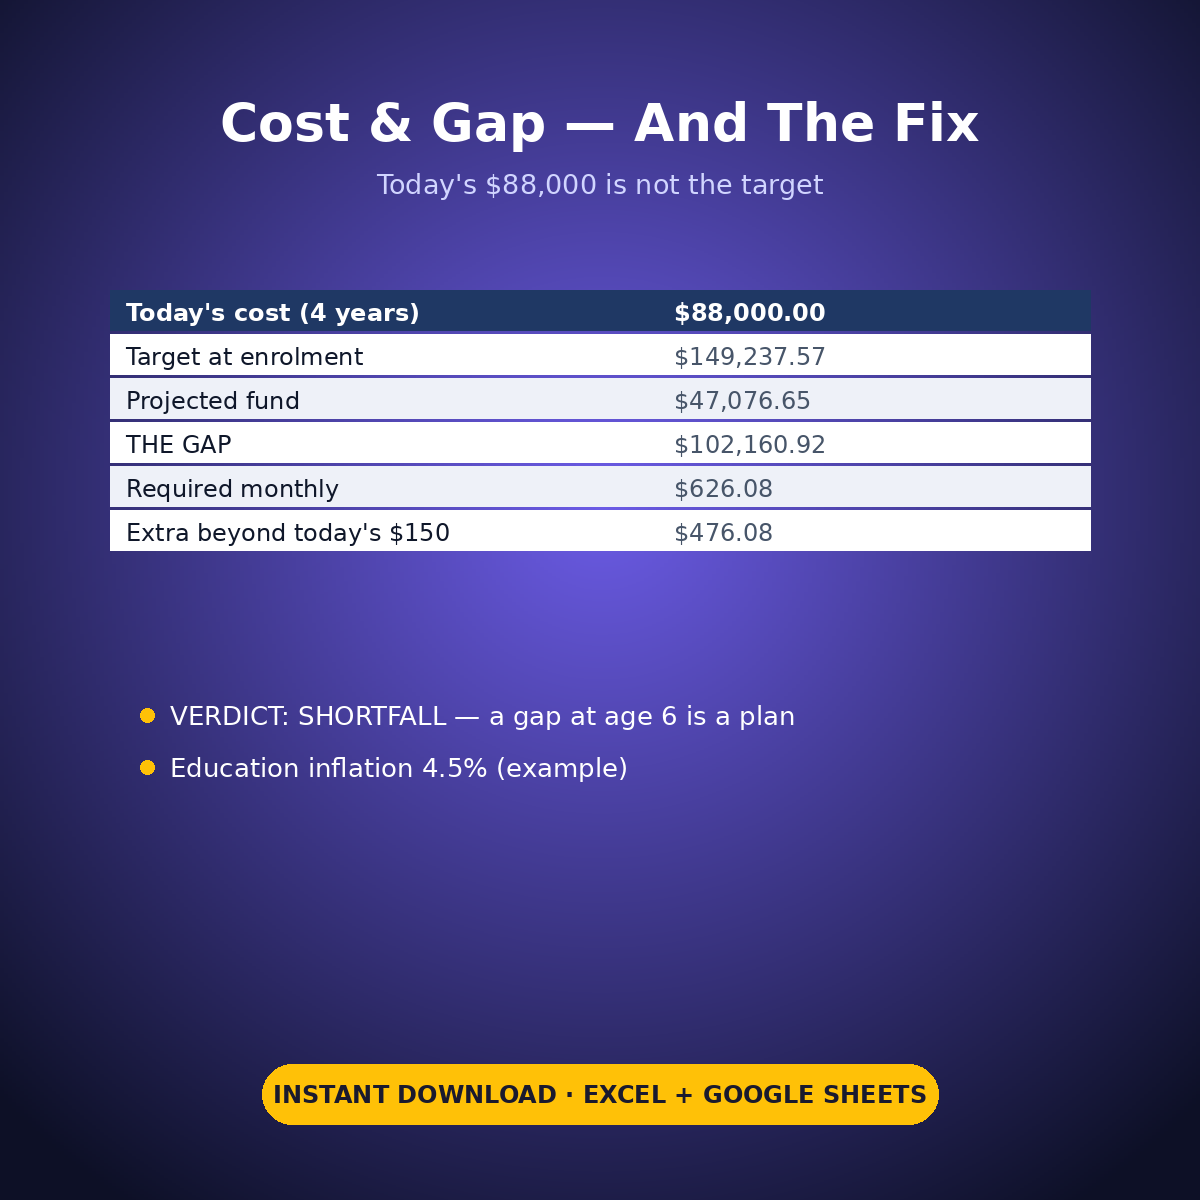
Then the honest part. The $88,000 target, inflated at the EXAMPLE 4.5% education-cost rate, is $149,237.57 in enrolment-year dollars. The verdict prints SHORTFALL — a gap of $102,160.92, not fudged one dollar smaller. And the fix is a number: at these assumptions the required contribution is $626.08 a month, $476.08 more than the current $150 (matching held at today’s grant in that figure — contribute more and the real grant rises toward its cap). A gap you can see when your child is 6 is a plan. The same gap at 17 is a crisis.
What it does for you:
– Projects year by year — 12 visible rows of contributions, grants and growth, no FV()
– Models grant matching as editable EXAMPLE settings (CESG-style 20% to a $500 cap; set 0 for a 529)
– Prices the target honestly: today’s cost inflated to enrolment-year dollars
– Prints the GAP and a SHORTFALL verdict with the amount — the sample gap is real and unhidden
– Computes the required monthly contribution that closes the gap, and the extra beyond your current one
– Adds a family expense log, zero-based monthly budget, dashboard and 12-month summary
What’s inside (.xlsx, works in Excel AND Google Sheets):
– Start Here — setup steps and every EXAMPLE setting (ages, savings, contribution, return, cost, education inflation, matching rate and cap)
– Projection — 12 year-by-year rows to enrolment with the matching grant on its own column
– Cost & Gap — the inflated target, the fund breakdown, the gap, the verdict and the fix
– Expense Log, Monthly Budget, Dashboard, Monthly Summary
Instant download. Type only in the yellow cells — formula cells are locked (password: sheetdaily, disclosed on the Start Here tab so you can unlock if you ever need to). Sample family is pre-filled so you can see exactly how it works; clear the yellow cells and type your own. Planning tool only — not financial, tax or education advice; grant rules, plan rules and tax treatment differ by country and plan and they change, so verify yours before acting on any number here.


Reviews
There are no reviews yet.