

A strong year is a lovely problem with sharp edges: it quietly rewrites your risk. This rebalancer turns “we should probably rebalance” into exact trades — per asset class, in dollars and in points — and then checks its own work three ways before you place a single order.
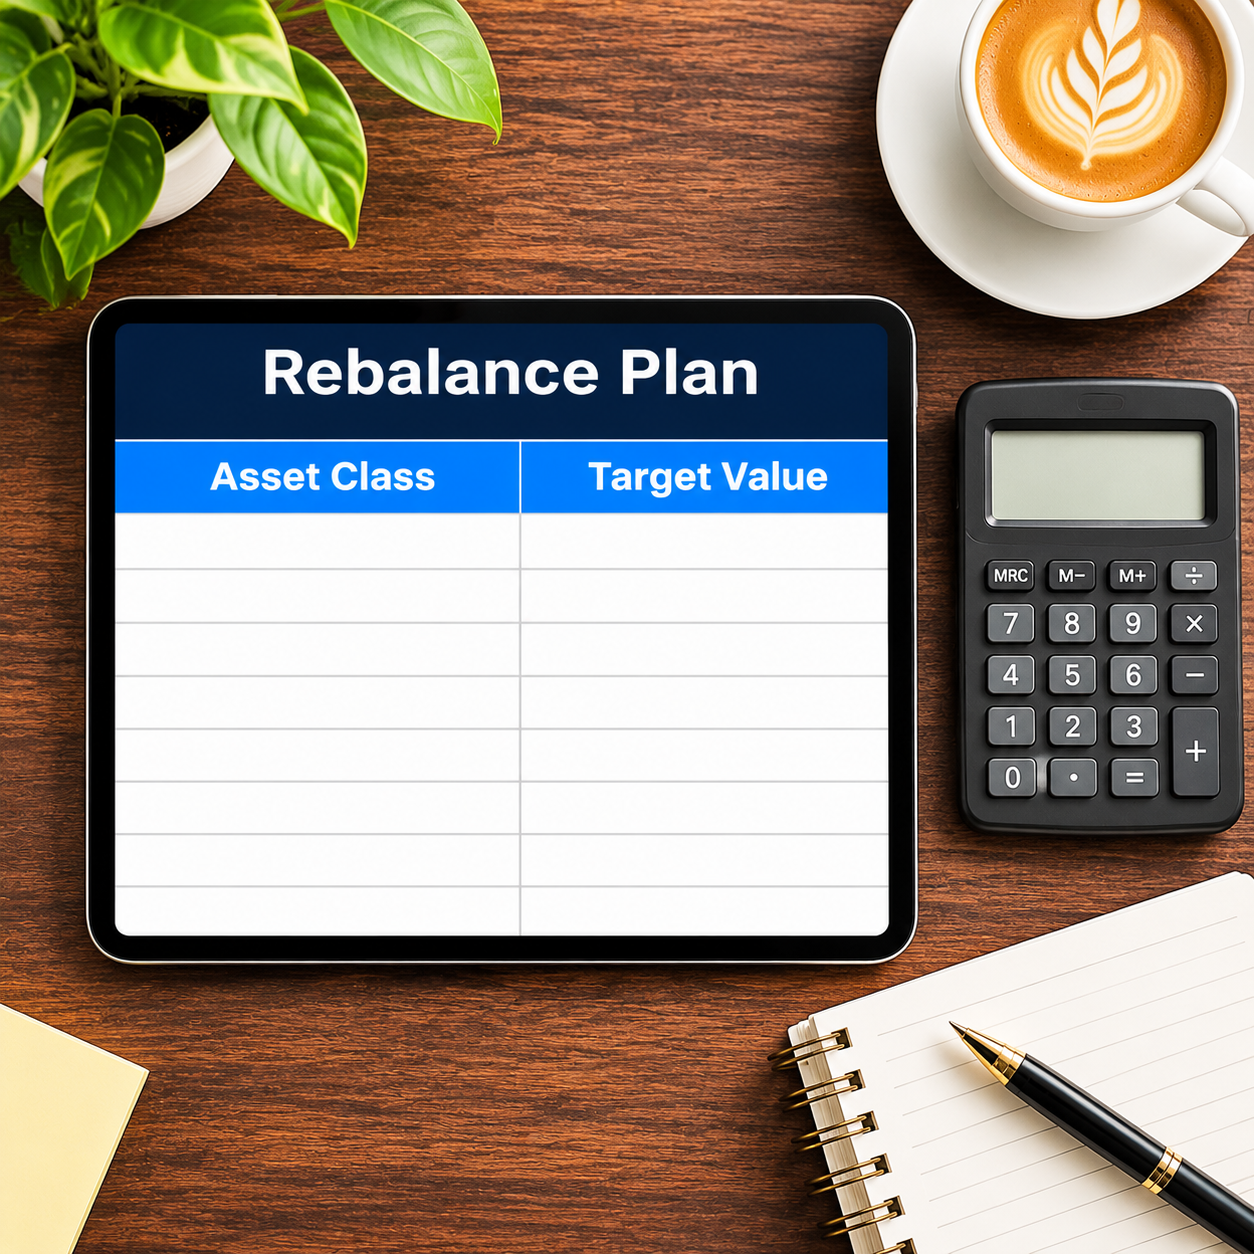
List the holdings once, each tagged with its asset class (US Equity, Intl Equity, Bonds, Real Estate, Cash in the sample — rename them to yours). Set the targets. The plan tab pulls every class total itself and shows current vs target side by side: value, %, target value, drift in dollars, drift in points, and the trade.
The sample is the classic post-run-up portfolio: $180,000, with US equity drifted to 53.9% against a 45% target. The trades print themselves — SELL $16,000 of US equity; BUY $10,500 of bonds, $4,900 of international equity, $600 of real estate. And cash, sitting at exactly 5.0% against a 5% target, gets its answer too: ON TARGET, $0 trade, printed rather than skipped, because “no trade needed” is information.
Then the checks, which are the real product. TARGET CHECK: your targets must total 100% — the sheet refuses to rebalance quietly toward 93%. NET CHECK: sells must equal buys to the cent ($16,000 = $16,000), because rebalancing moves money and never creates it. SELL-SAFETY CHECK: no sell may exceed what its class actually holds. If a check fails, your inputs are wrong — fix them, never the formulas. Taxes and trading costs are stated plainly as NOT modelled; the BUY column doubles as the map for rebalancing with new contributions first.
What it does for you:
– Rolls holdings up by asset class automatically — no hand-totalling per class
– Shows drift in BOTH dollars (the trade) and points (the distance from target)
– Prints exact BUY / SELL amounts per class, and $0 ON TARGET where no trade is needed
– Refuses bad inputs: targets must total 100%, sells must equal buys, no sell exceeds its holding
– Doubles as a contribution map — new money goes where the BUY column points
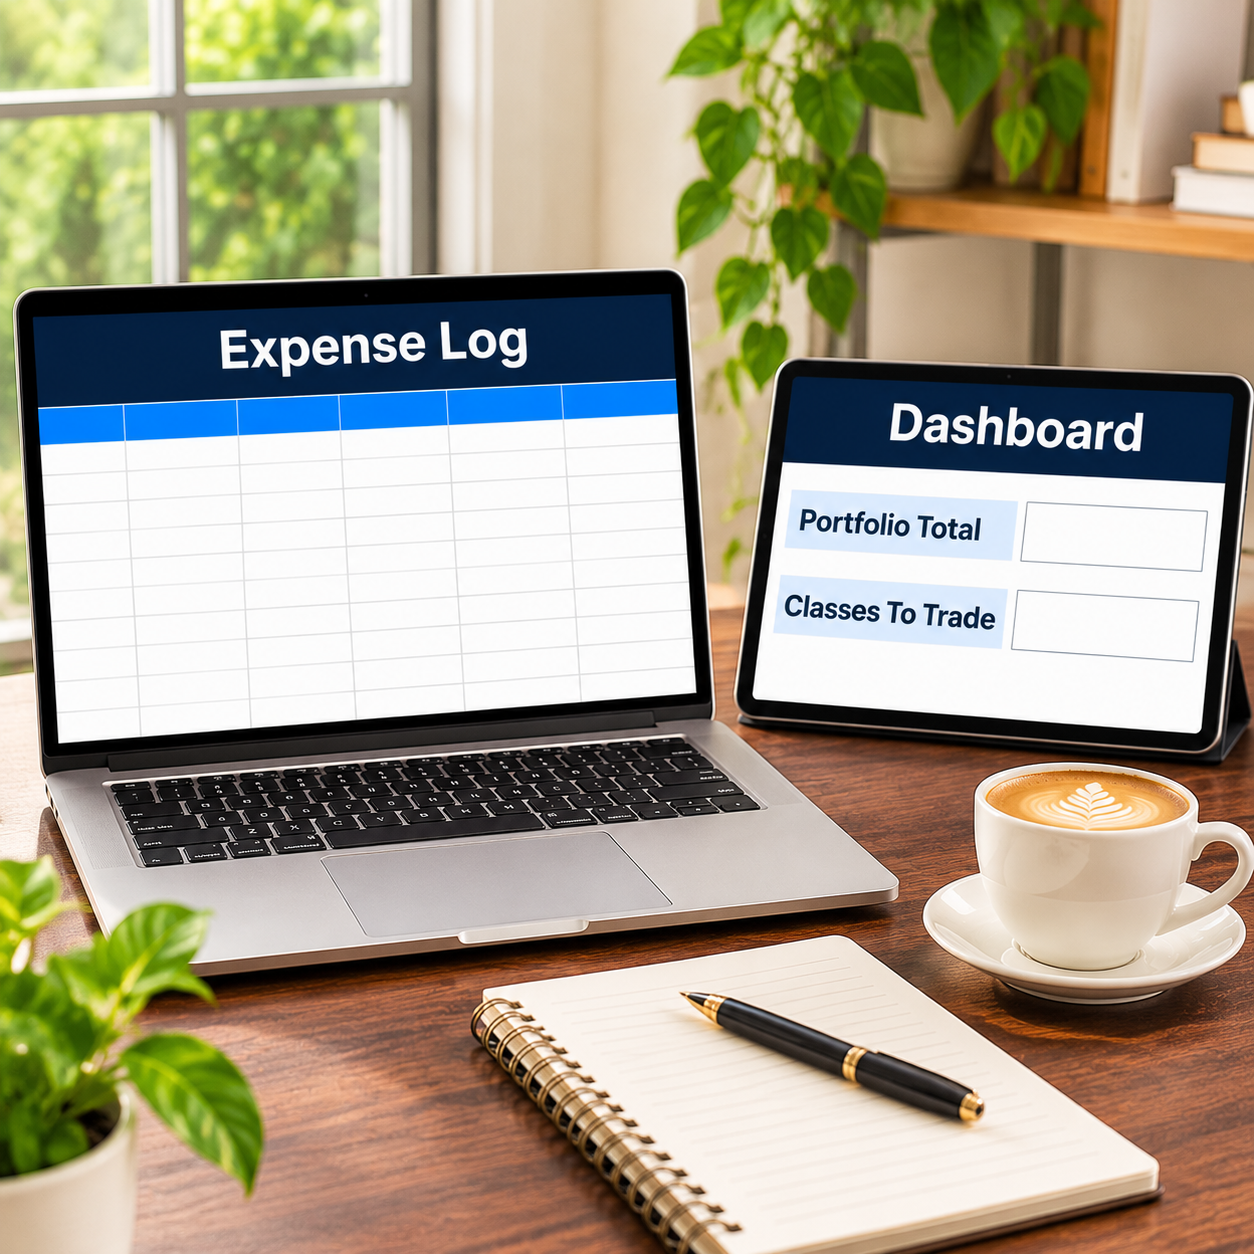
– Adds an investing-cost expense log, zero-based monthly budget, dashboard and 12-month summary
What’s inside (.xlsx, works in Excel AND Google Sheets):
– Start Here — setup steps and the EXAMPLE drift-threshold setting
– Holdings — 9 sample holdings tagged by class, portfolio total
– Rebalance Plan — 5 classes with drift in $ and points, exact trades, and the three checks
– Expense Log, Monthly Budget, Dashboard, Monthly Summary
Instant download. Type only in the yellow cells — formula cells are locked (password: sheetdaily, disclosed on the Start Here tab so you can unlock if you ever need to). Sample portfolio is pre-filled so you can see exactly how it works; clear the yellow cells and type your own. Planning tool only — not investment advice; taxes and trading costs are not modelled, and your allocation is your decision.



Reviews
There are no reviews yet.