

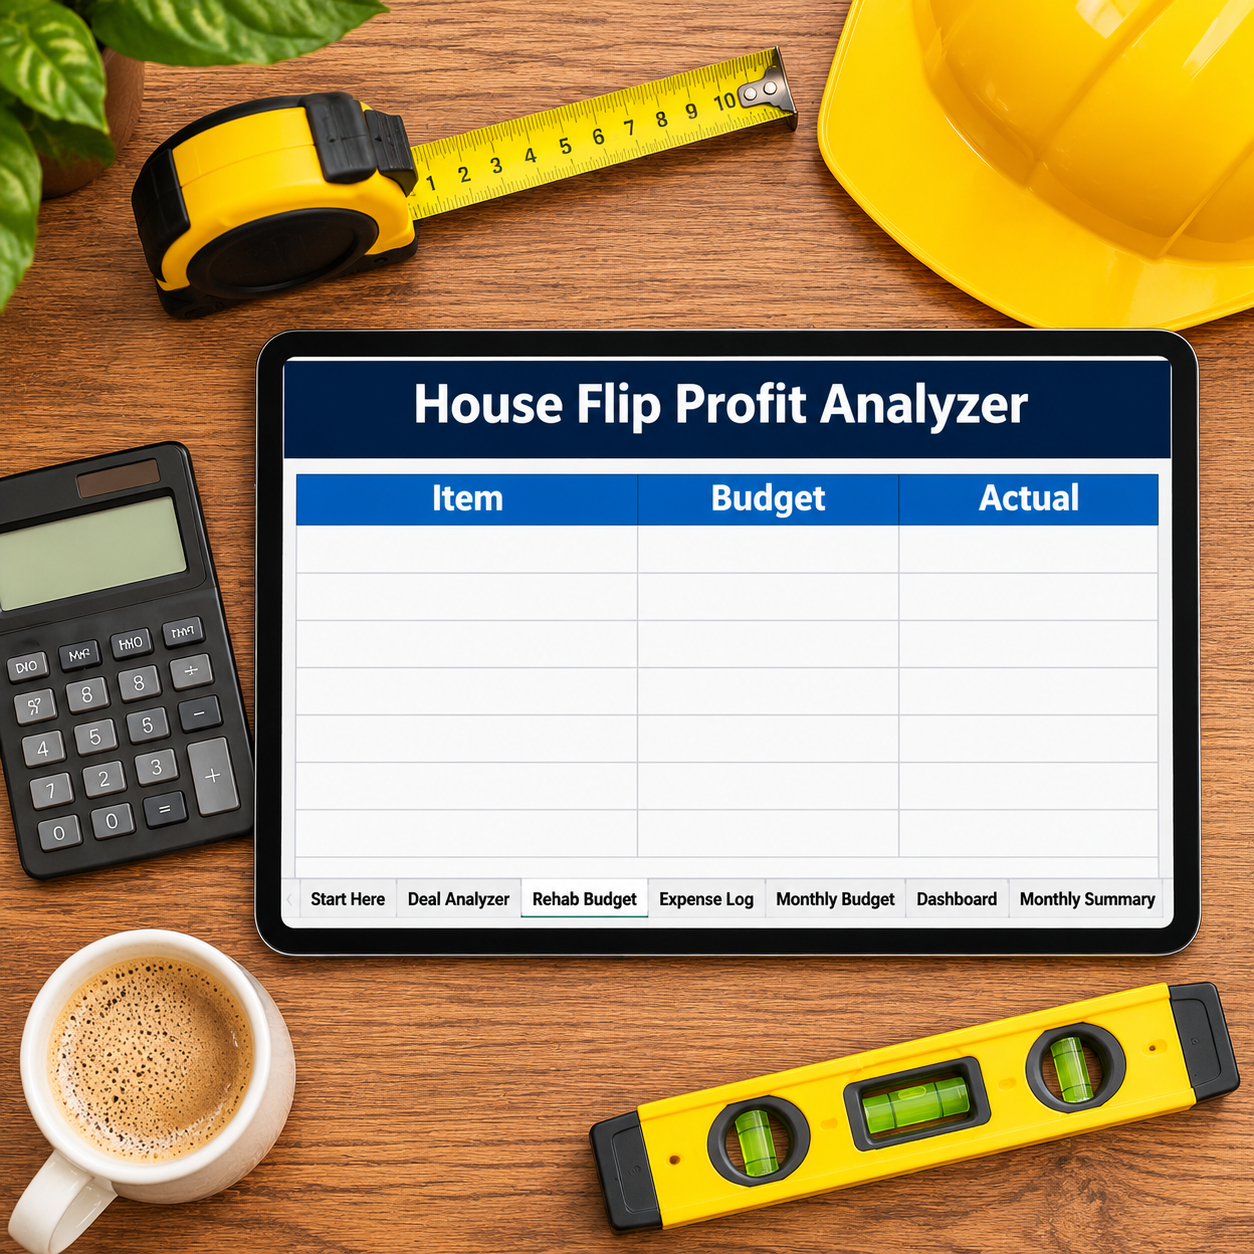

Flips do not die on the purchase price. They die on the two points nobody modelled, the sixth month of interest nobody budgeted, the rehab line that ran over, and the commission on the way out. This analyzer puts every one of those costs in the room before you commit — then tracks the rehab against its budget while the project runs. The pre-filled sample: a $320,000 ARV bought for $185,000 with a $51,300 rehab. After contingency, hard-money points and interest, six months of holding and full selling costs, the all-in cost is $286,496.26 and the projected profit is $33,503.74 — a 10.5% margin that meets its target and a 60.7% return on the $55,211.26 of cash actually tied up. And the sheet still tells the truth on the other screen: at $185,000 the deal FAILS the 70% rule by $12,300. Profitable and over the rule — a flipper needs both numbers, not the comfortable one.
What it does for you:
– Every cost category in one model: purchase, 16-line rehab budget plus contingency, hard-money points and interest-only carry at YOUR terms, six itemized holding lines, buy closing, agent commission and seller closing. The profit is the real one because nothing is “miscellaneous”.
– Return on the cash you actually tie up: closing cash + points + interest + holding = the denominator that matters. The sample returns 60.7% on cash in 6 months — 121.4% annualized, so a 4-month flip and a 9-month flip finally compare fairly.
– The 70% rule, judged: max allowable offer computed from YOUR rule factor (70% pre-filled) minus the rehab budget — $172,700 on the sample — with the overpay shown in dollars and a plain PASS/FAIL verdict.
– Break-even sale price: $283,974.47 on the sample. Soft market, slow sale, lowball offer — you know the floor below which the flip loses money before anyone negotiates.
– A Rehab Budget that runs the project: budget vs actual per line, overruns flag themselves (the sample’s roof and kitchen are over; 75% of budget spent, $12,700 remaining), and the budget total feeds the analyzer — one set of numbers, start to finish.
What’s inside (.xlsx, works in Excel AND Google Sheets):
– Start Here — plain-English setup + your settings (your target profit margin, your 70% rule factor)
– Deal Analyzer — ARV, price, rehab, hard money, holding and selling in; all-in cost, NET PROFIT, margin, ROI, annualized ROI, MAO, break-even and verdicts out
– Rehab Budget — 16 rehab lines, budget vs actual, variance and over-budget flags; totals flow into the analyzer
– Expense Log — deal-hunting spending, categorized
– Monthly Budget — zero-based, Budget vs Actual fills itself
– Dashboard — profit, margin, ROI, MAO and break-even on one screen
– Monthly Summary — spending by month, Jan–Dec
Instant download. Yellow cells are yours to type in; every formula cell is locked (password sheetdaily, shown in Start Here) so nothing breaks by accident. The sample deal is pre-filled so you can see the math working — replace it with your own. Analysis tool only — not financial or investment advice.

Reviews
There are no reviews yet.