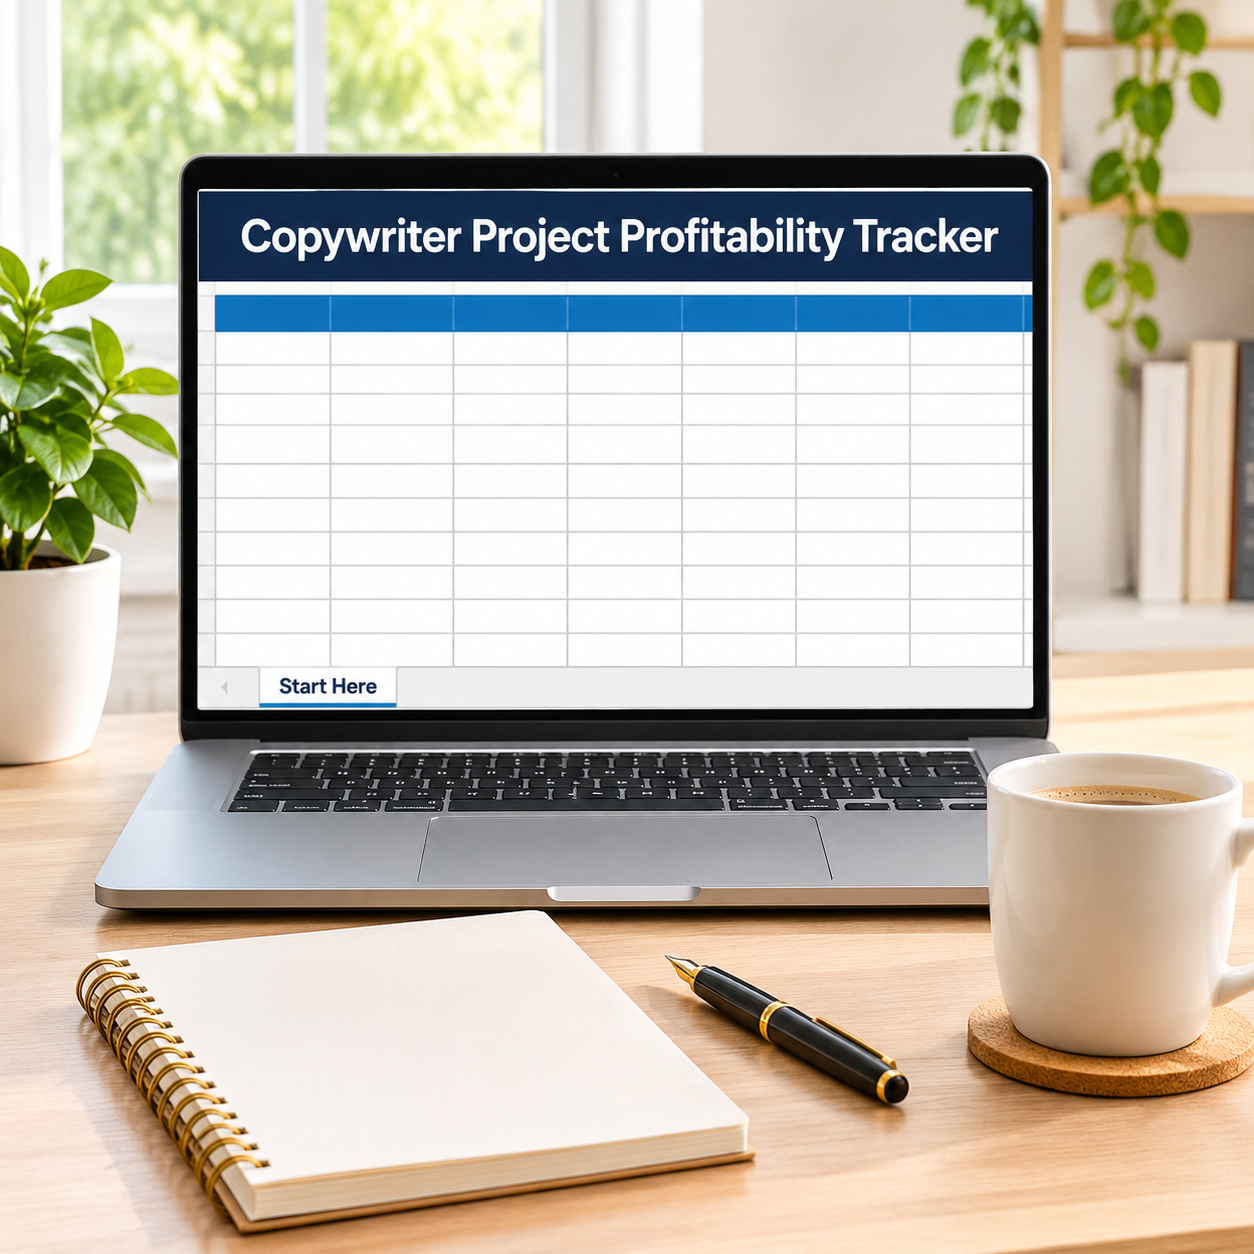
A $1,500 sales page sounds like a great project — until you count the 26 hours and 5 revision rounds it actually took, and find it paid you $56.15 an hour. This tracker prices every copywriting project the honest way: fee vs hours vs revision rounds vs direct costs, per project AND per client. The pre-filled sample runs 8 projects: $8,600 in fees over 129.5 hours keeps $65.33/hr blended — and once your admin hours count, the TRUE rate is $59.79/hr against a $75 target. Only 2 of the 8 sample projects actually hit the target. Now you know which work to reprice.
What it does for you:
– Effective $/hr, twice over: gross rate (fee ÷ hours) and kept rate (profit after direct costs ÷ hours) on every project, so a high fee with high costs can’t fool you.
– Revision rounds, counted: the sample averages 2.75 rounds per project, and the projects with 4–5 rounds are exactly the ones flagged Below target — charge for rounds, or cap them, with evidence.
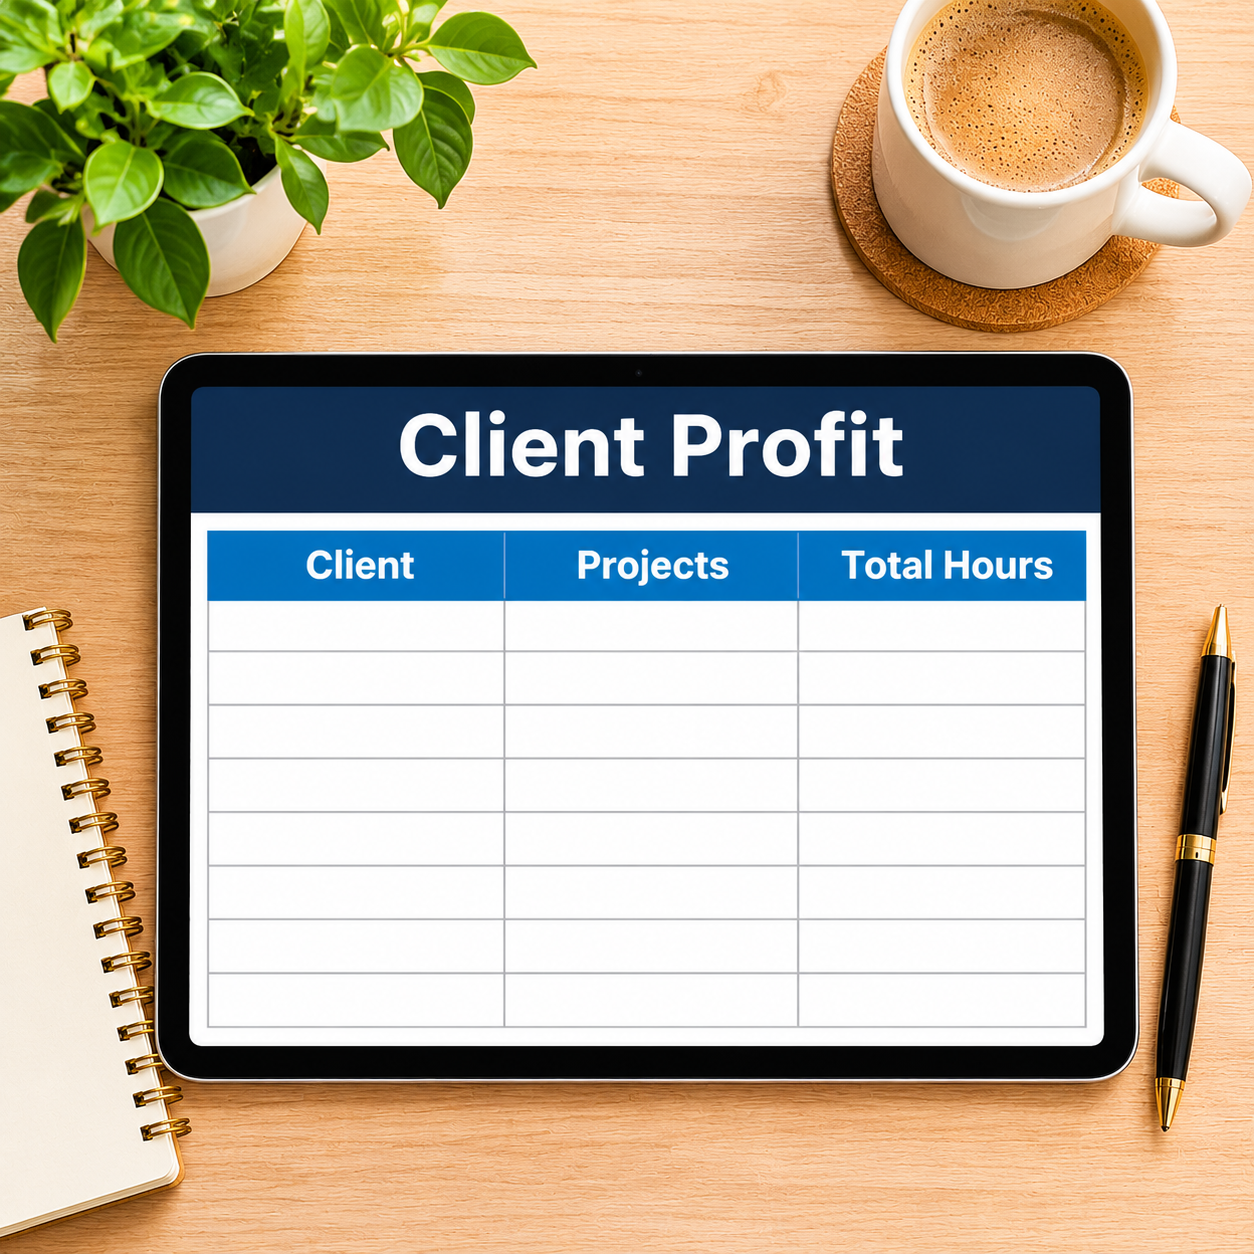
– Clients ranked by what they pay you per hour: Northbeam SaaS keeps $85.00/hr across 2 projects; Summit E-commerce keeps $60.88/hr. Same you, 40% difference — the Client Profit tab makes it impossible to miss.
– The TRUE rate includes the invisible work: add your monthly admin/unbilled hours once and the blended rate drops from $65.33 to $59.79 — the number your pricing decisions should actually use.
– Every project judged against YOUR target: set the rate you want to keep per hour and each project flags On target ✓ or Below target automatically.
What’s inside (.xlsx, works in Excel AND Google Sheets):
– Start Here — plain-English setup + your settings (target kept rate, admin hours per month)
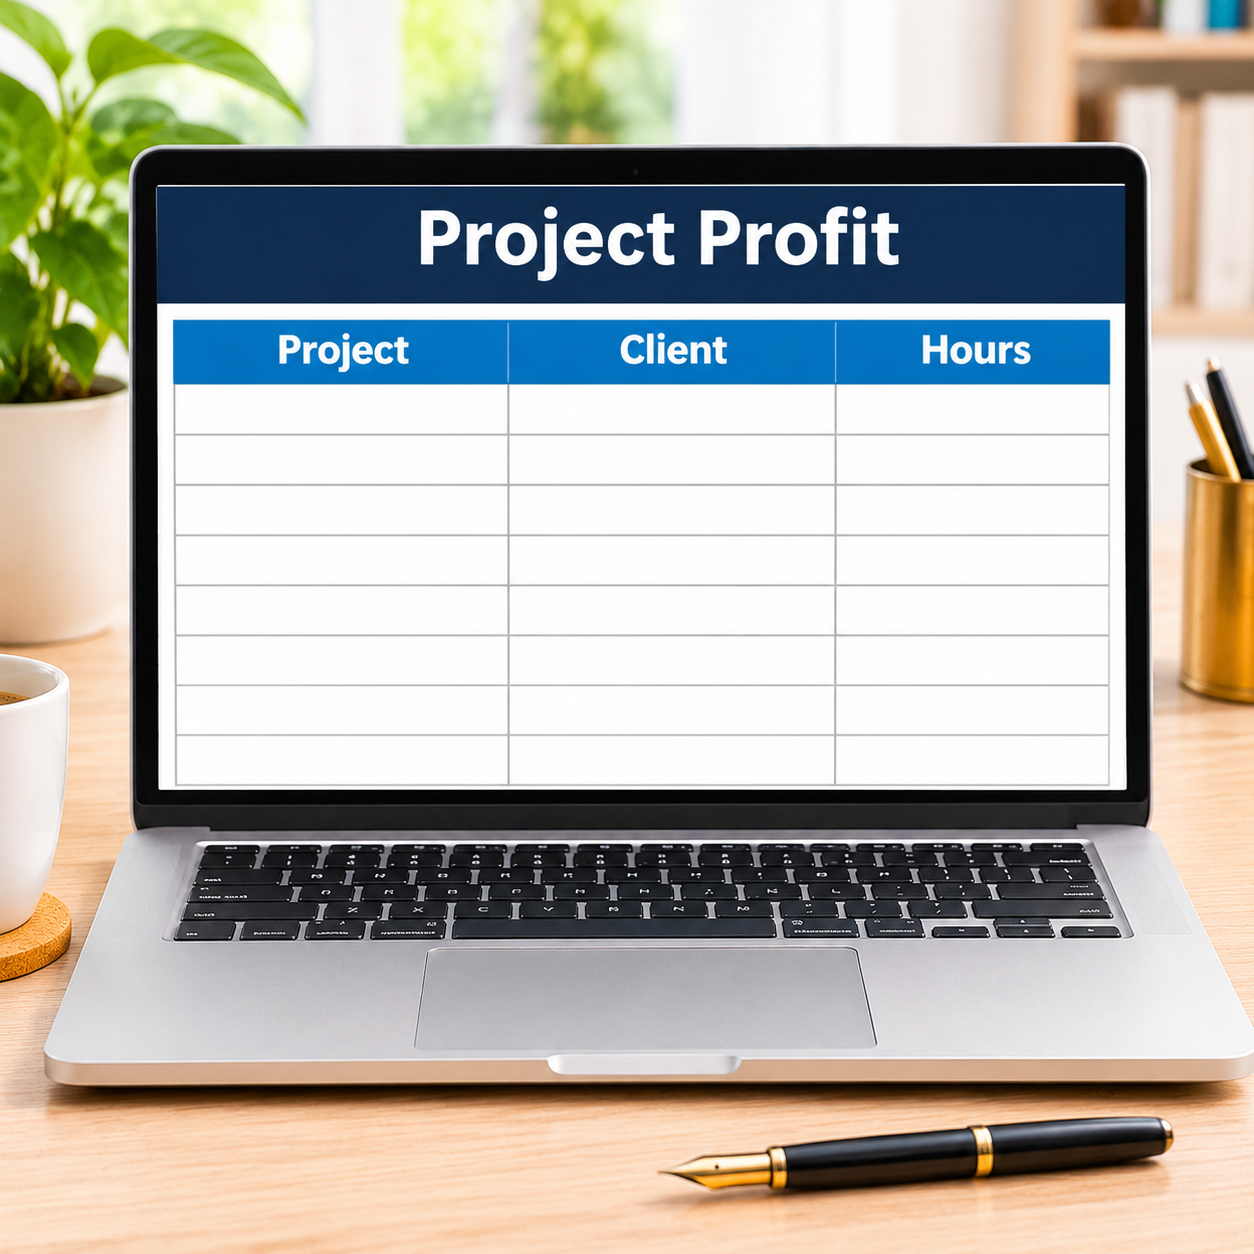
– Project Profit — 12 project rows: fee, hours, revision rounds, direct costs → profit, margin %, gross $/hr, kept $/hr, vs-target flag
– Client Profit — automatic per-client roll-up: projects, fees, hours, profit, effective and kept rates
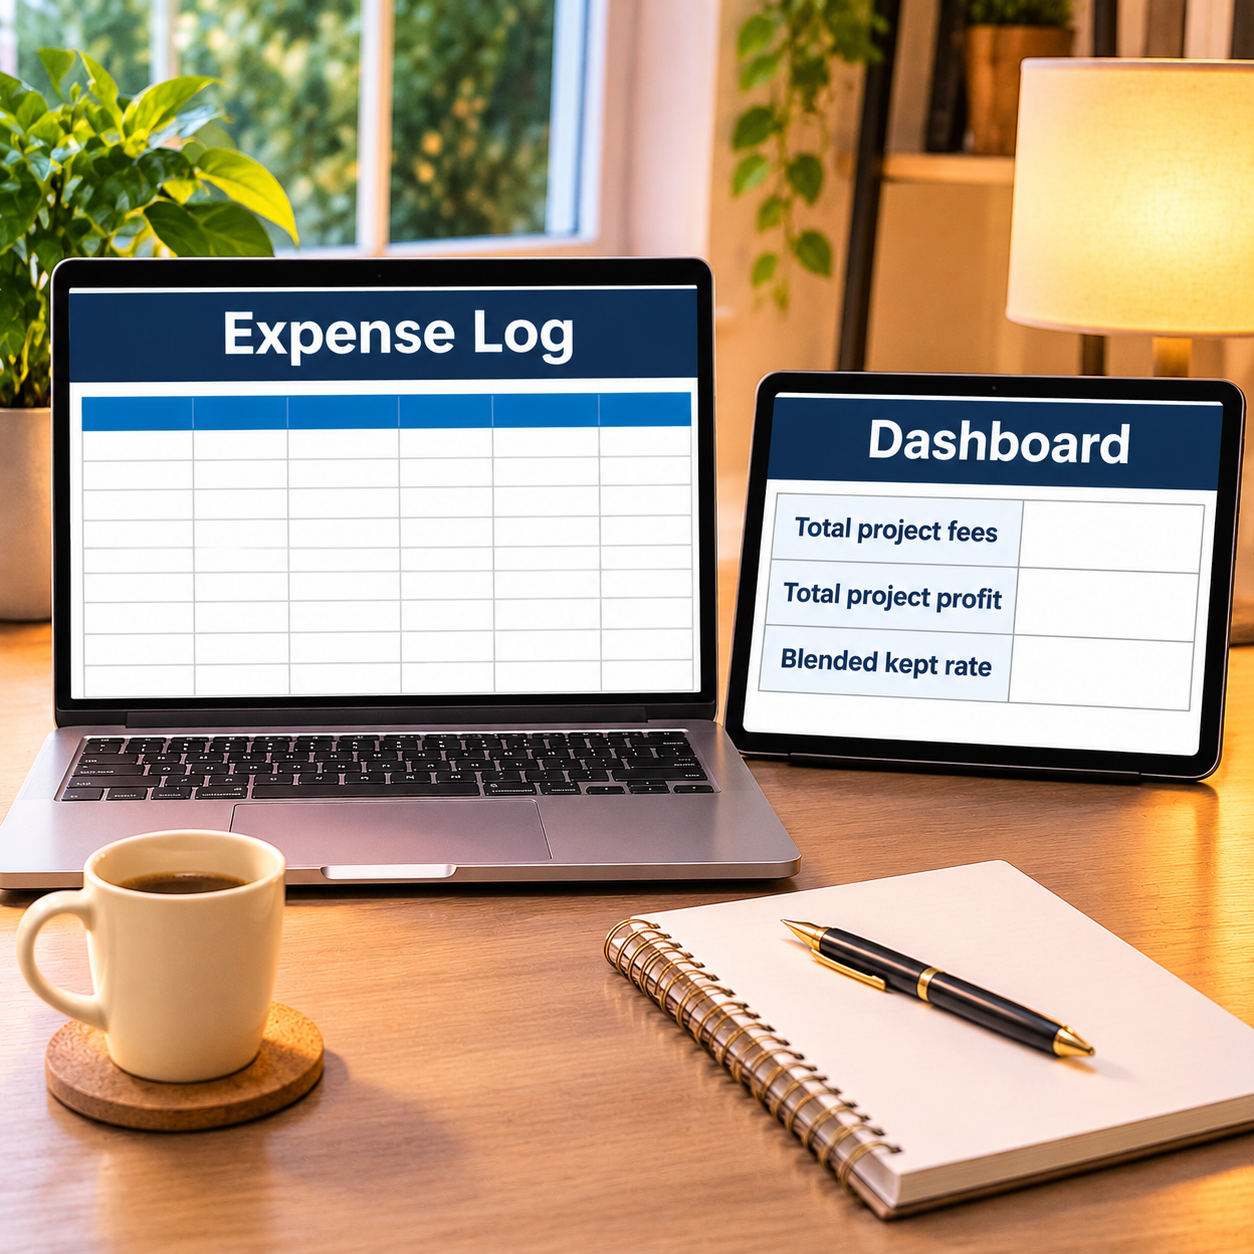
– Expense Log — business spending, categorized
– Monthly Budget — zero-based, Budget vs Actual fills itself
– Dashboard — fees, profit, blended and TRUE rates on one screen
– Monthly Summary — spending by month, Jan–Dec
Instant download. Yellow cells are yours to type in; every formula cell is locked (password sheetdaily, shown in Start Here) so nothing breaks by accident. Sample projects are pre-filled so you can see the math working — replace them with your own.



Reviews
There are no reviews yet.