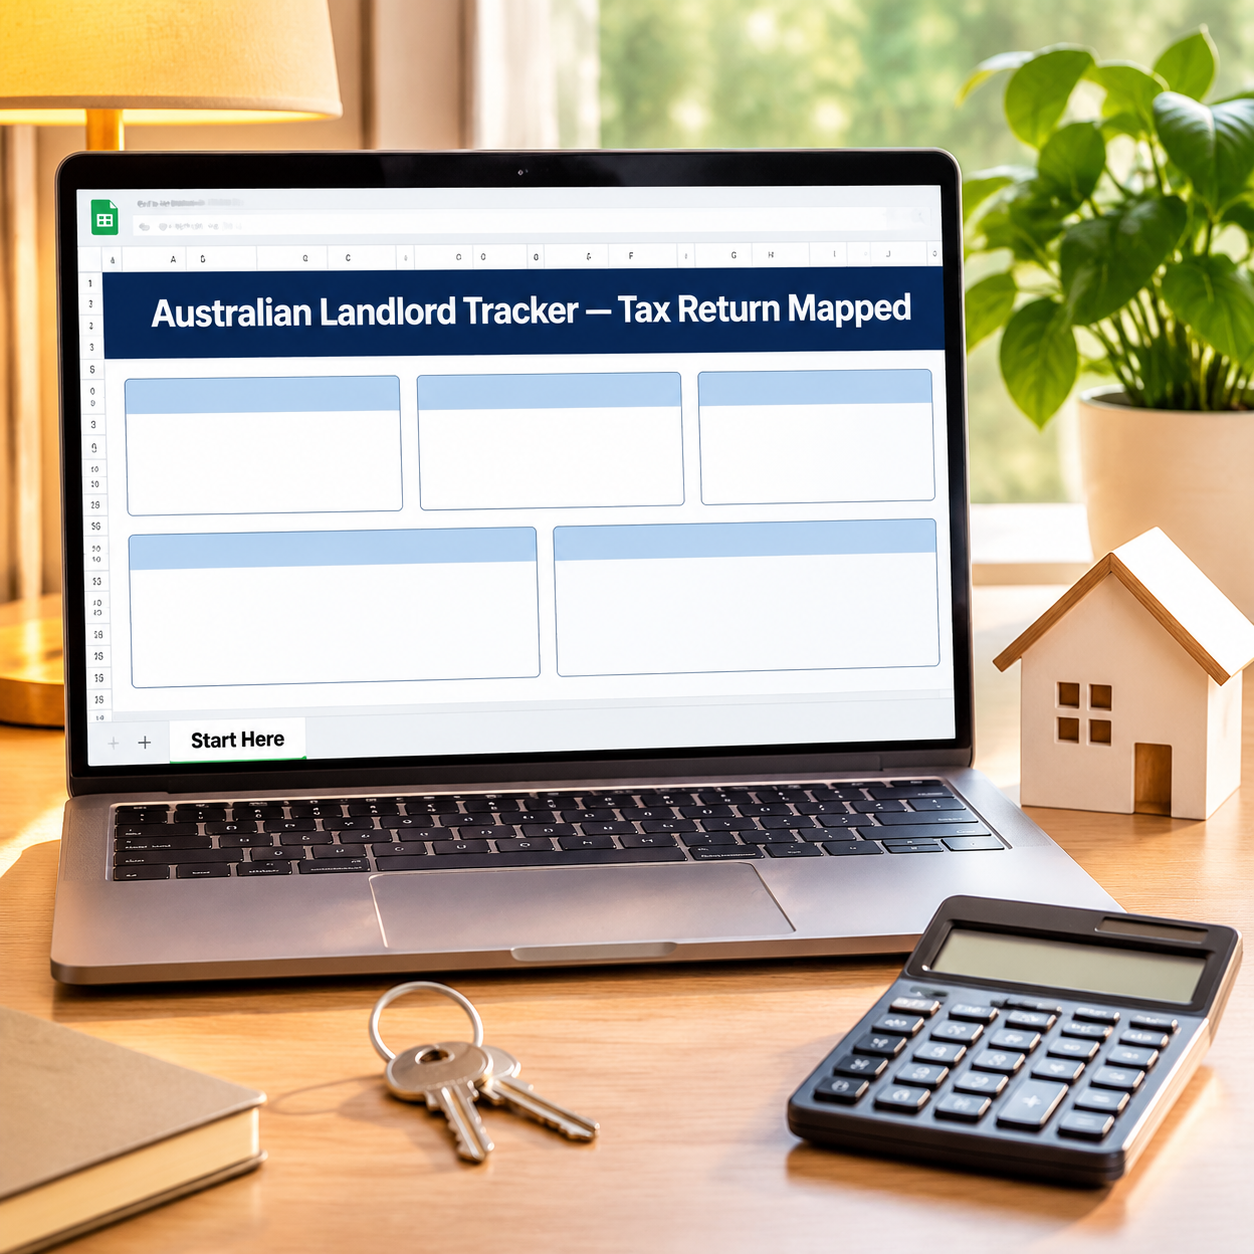
Australian landlords live on a July-to-June clock and a single question: what is each property really doing to my tax position? This tracker keeps the whole financial year in rental-schedule shape as you go — every entry carries its property and its ATO rental-schedule category — and states the gearing position of every property, and the portfolio, in plain words. A loss is shown as a loss. The sample portfolio: $10,000 of rent against $12,300 of expenses for a NET RENTAL POSITION of −$2,300 — NEGATIVELY GEARED — with one property positive at +$690 and the other two carrying the loss, plus an illustrated tax benefit of $851.00 at the sample’s example marginal rate.
What it does for you:
– Rental-schedule categories from day one: rent, interest, agent fees, repairs, council rates, insurance, depreciation (decline in value — entered from YOUR schedule), capital works, and the rest of the ATO label list as an editable example mapping for FY 2026–27, adjustable to the current rental properties guide.
– Gearing per property, not just per portfolio: the sample’s Wollongong unit is positively geared (+$690) while Geelong (−$240) and Cairns (−$2,750) drag the portfolio to −$2,300. Portfolio-only trackers hide exactly this.
– The negative-gearing position, carried visibly: the net loss sits on the FY Summary and the Dashboard as a loss — plus an ILLUSTRATION of its tax benefit at YOUR marginal rate example setting ($851.00 on the sample at 37%) and your other income after the loss ($82,700 on $85,000). Your rate, your numbers, clearly labelled an example — not ATO advice.
– A financial-year view (1 July – 30 June): per-property net in rental-schedule order, ready for your tax agent, instead of a calendar-year scramble in June.
– The business around the properties: categorized expense log, zero-based monthly budget, and a dashboard with income, net position and gearing on one screen.
What’s inside (.xlsx, works in Excel AND Google Sheets):
– Start Here — plain-English setup + your settings (your marginal tax rate and other income as verify-and-replace EXAMPLE settings)
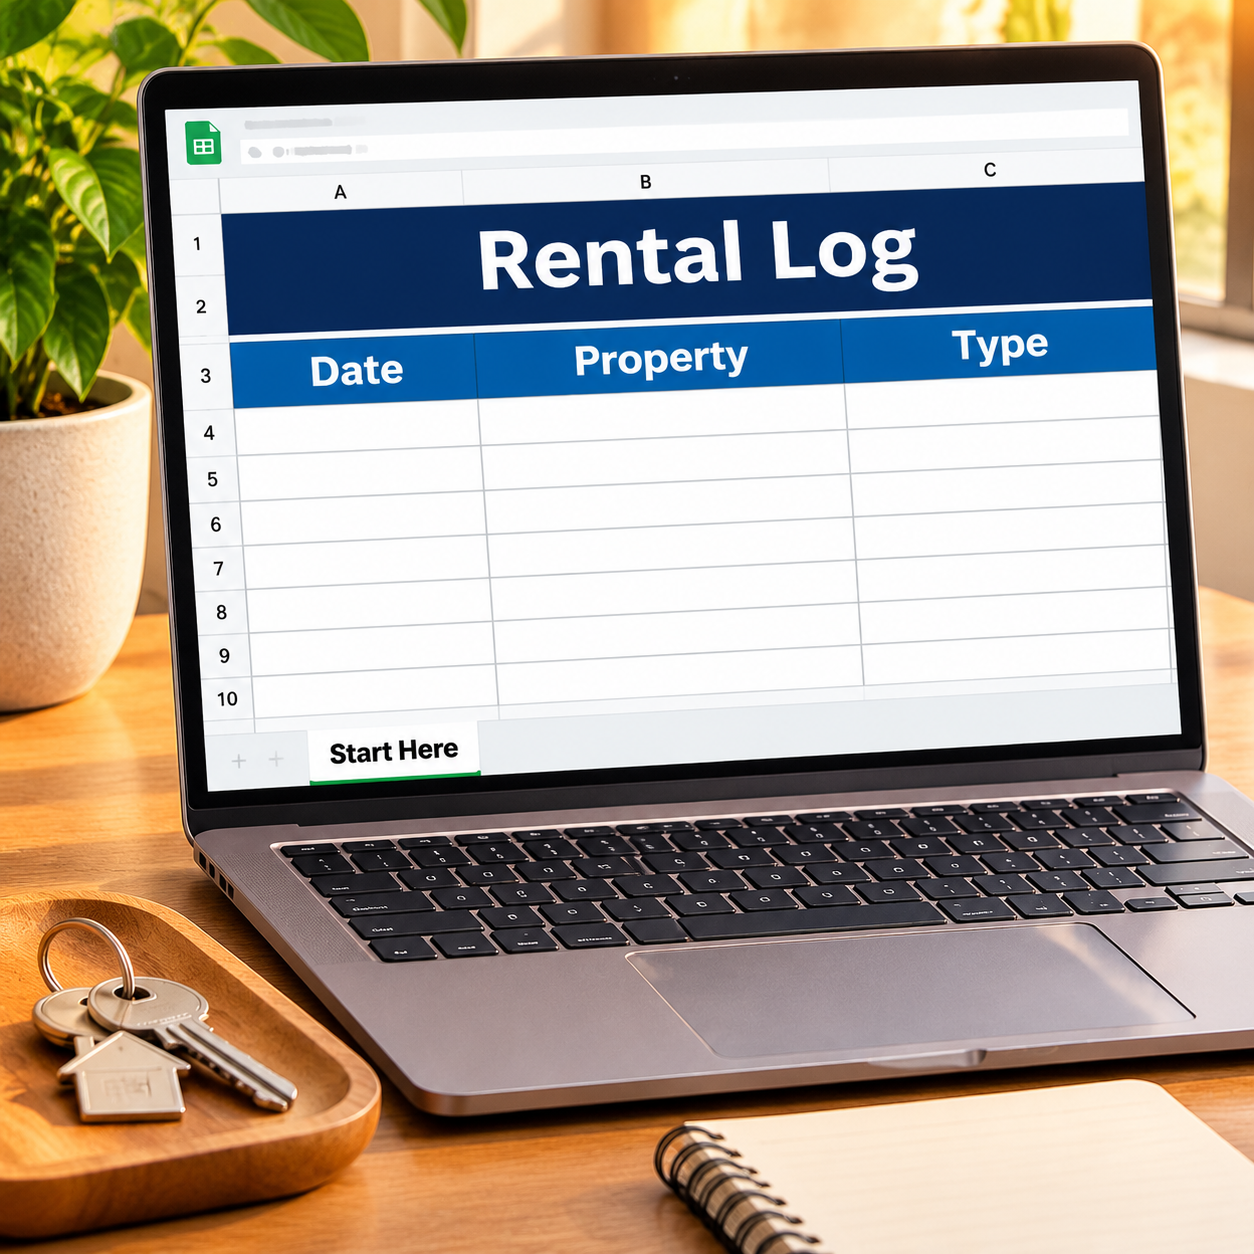
– Rental Log — 24 entry rows: date, property, income/expense, ATO rental-schedule category, note, amount
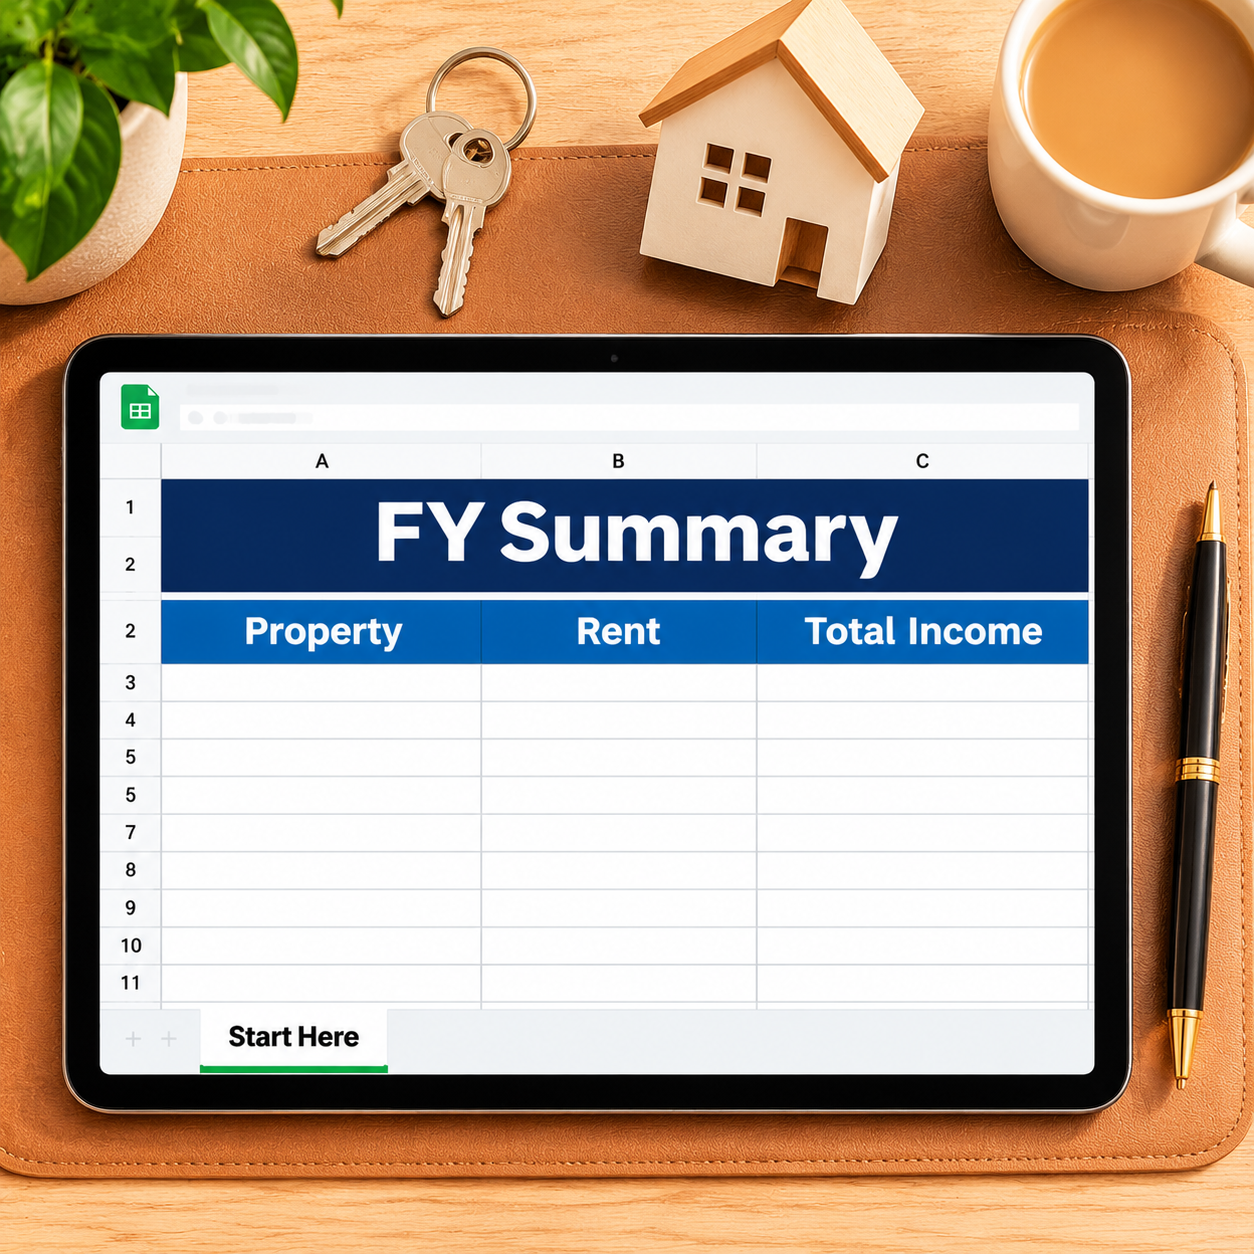
– FY Summary — per-property income, expenses by category, NET and gearing + the financial-year tax picture with the loss illustration
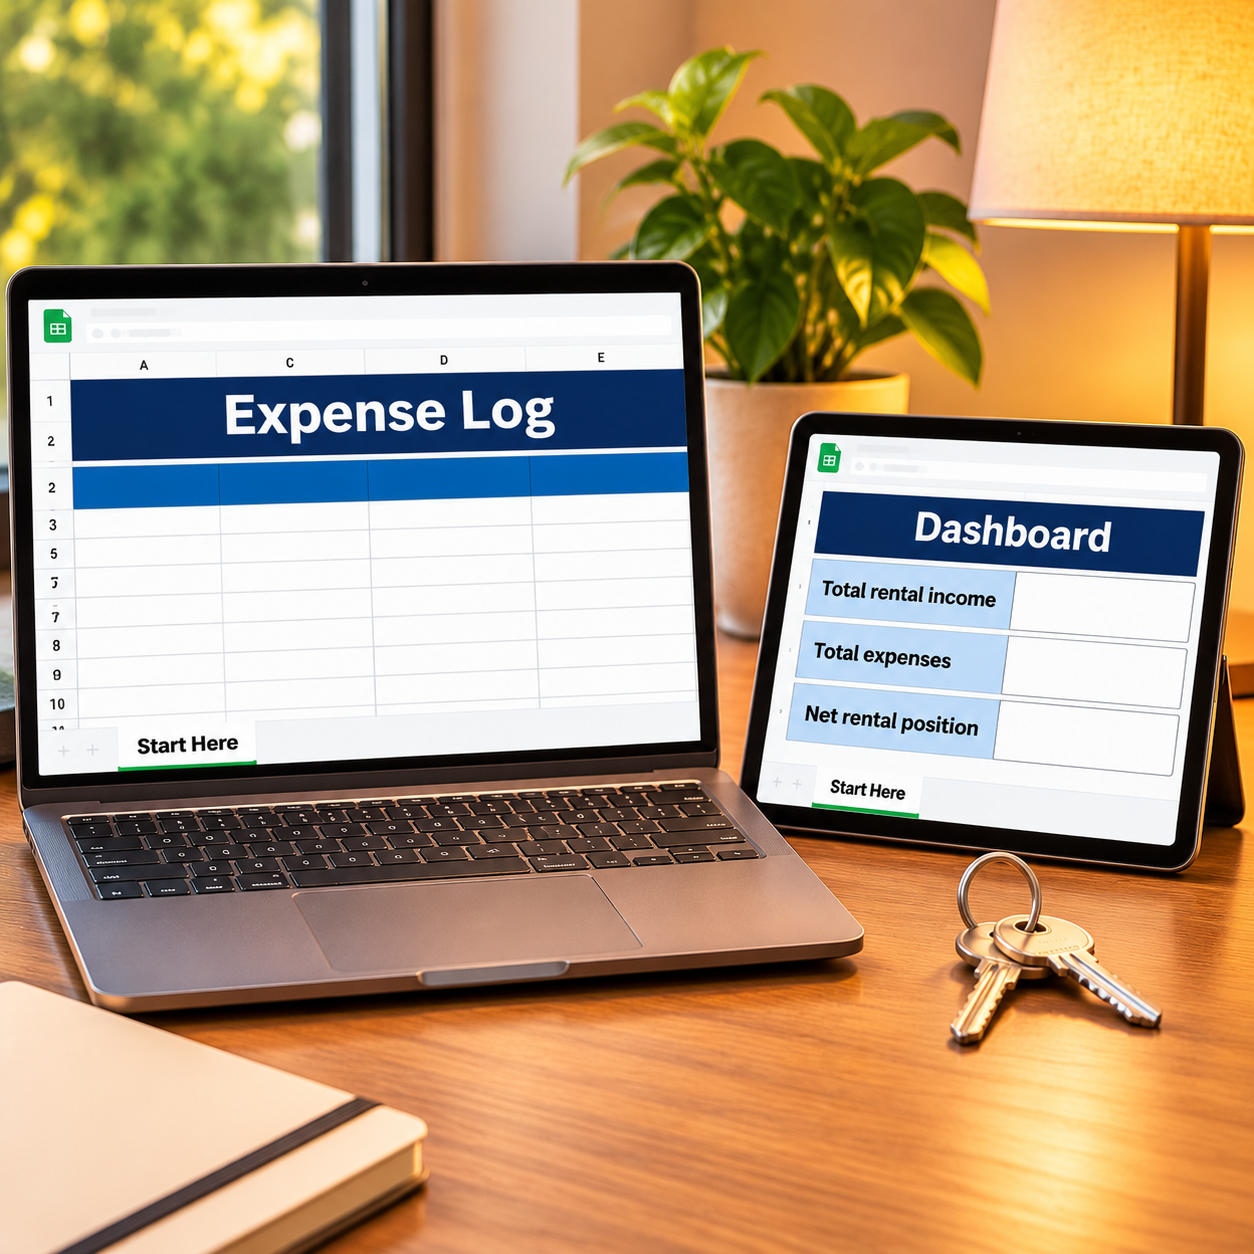
– Expense Log — other business spending, categorized
– Monthly Budget — zero-based, Budget vs Actual fills itself
– Dashboard — FY income, net rental position and gearing on one screen
– Monthly Summary — spending by month, Jan–Dec
Instant download. Yellow cells are yours to type in; every formula cell is locked (password sheetdaily, shown in Start Here) so nothing breaks by accident. Sample entries are pre-filled so you can see the math working — replace them with your own. The rental-schedule category mapping, depreciation amounts and the marginal rate are example settings for FY 2026–27, not tax law or advice: check the current ATO rental properties guide or ask your tax agent, and update them to yours.



Reviews
There are no reviews yet.