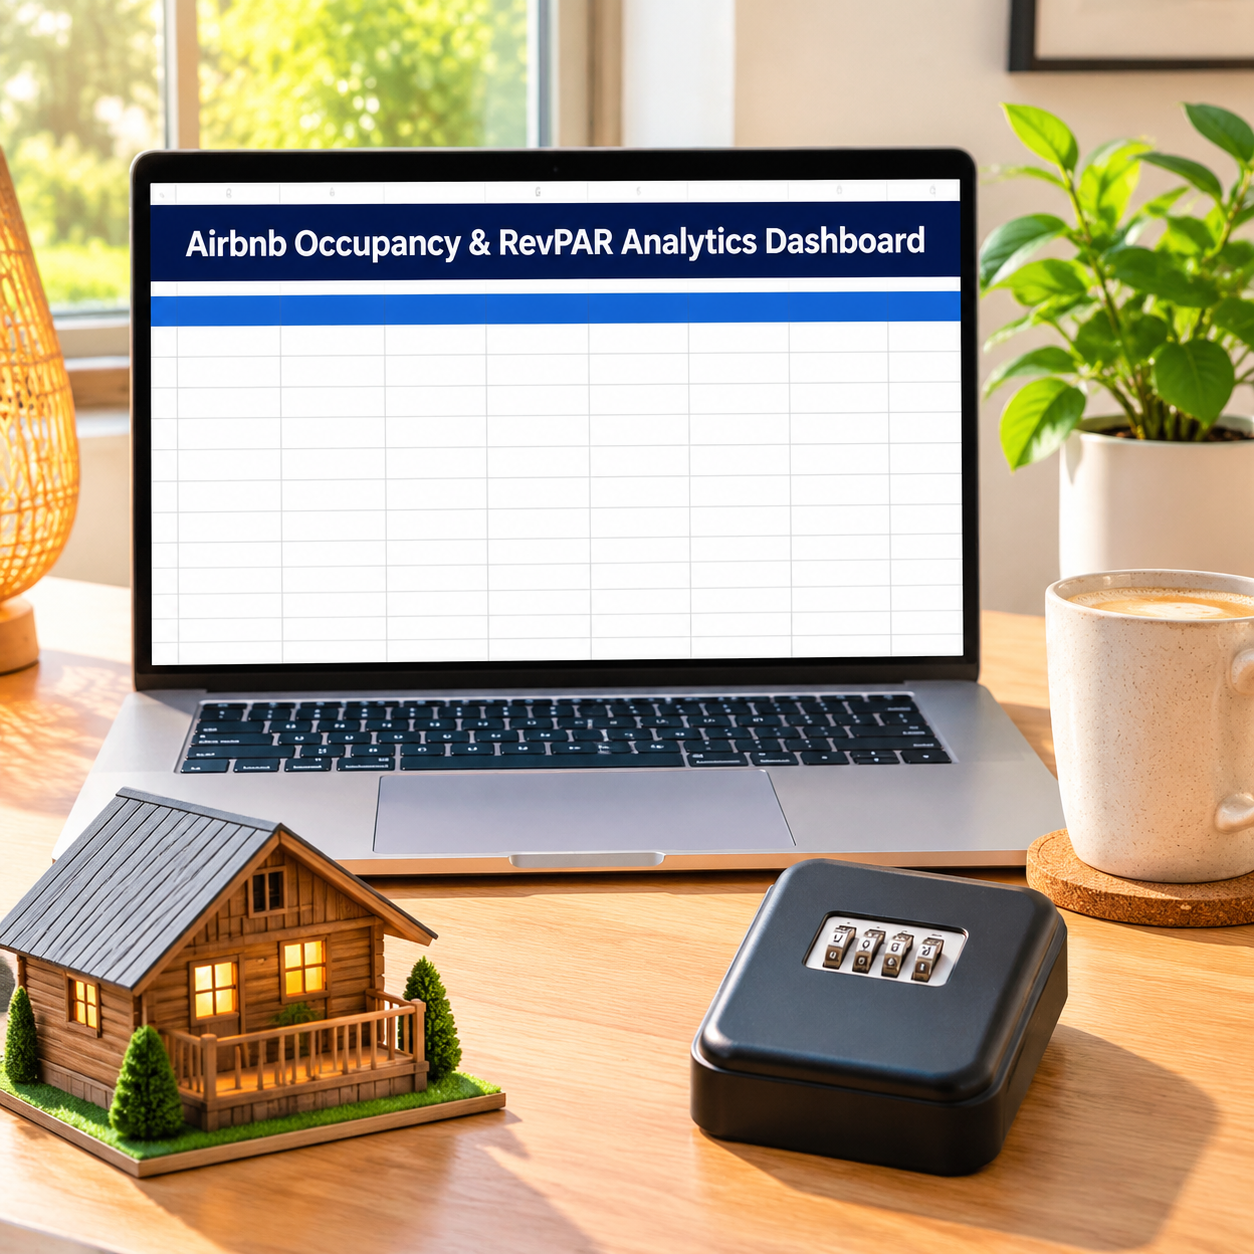
Hosts quote their ADR like it is the score. It is not — it is half of it. The score is RevPAR: what every available night earned, booked or not, because empty nights are where STR money actually leaks. This dashboard computes the real scoreboard from your booking log — you never type a metric. Log each stay once (nights, rate, cleaning fee, cleaner cost) and the workbook produces occupancy, ADR and RevPAR by month, by property and for the portfolio, plus your payout AFTER the platform’s host fee and the one number no rival shows: whether cleaning makes or loses money on every turn. The pre-filled sample season (2 properties, 16 bookings, Jul–Oct): $13,950 gross becomes $13,531.50 in your pocket after $418.50 of host fees; ADR of $182.72 beats the $165 target every single month — while 45.3% occupancy drags RevPAR to $82.83 against a $95 target. Rate is not the problem. Empty nights are, and now they are priced.
What it does for you:
– RevPAR, computed not typed: occupancy, ADR and RevPAR roll up from the booking log by month — July’s RevPAR of $104.18 against October’s $75.33 is your seasonality, measured from your own stays instead of a market report’s averages.
– Your payout, after the fee: every booking shows gross, the host fee at YOUR example setting (3% pre-filled — platforms change it; check yours and replace it), and what actually lands. Platform dashboards show gross; this one shows yours.
– Cleaning profit per turn: fee charged minus what the cleaner cost, per stay and on average — +$17.19 a turn on the sample. If your cleaning line quietly loses money, this is where you find out.
– Two properties, honestly compared: the cabin’s ADR is $208.25 against the condo’s $164.85, while the condo books more nights — and channels are split out too (Airbnb is 63.7% of the sample’s nightly revenue; direct bookings cost no fee at all).
– Targets with a diagnosis: occupancy, ADR and RevPAR are judged against your targets on Start Here, and the flags name the leak — the sample passes ADR and fails occupancy and RevPAR, so the fix is filling nights, not cutting rates.
What’s inside (.xlsx, works in Excel AND Google Sheets):
– Start Here — plain-English setup + your settings (host fee % as a replaceable EXAMPLE, your occupancy/ADR/RevPAR targets)
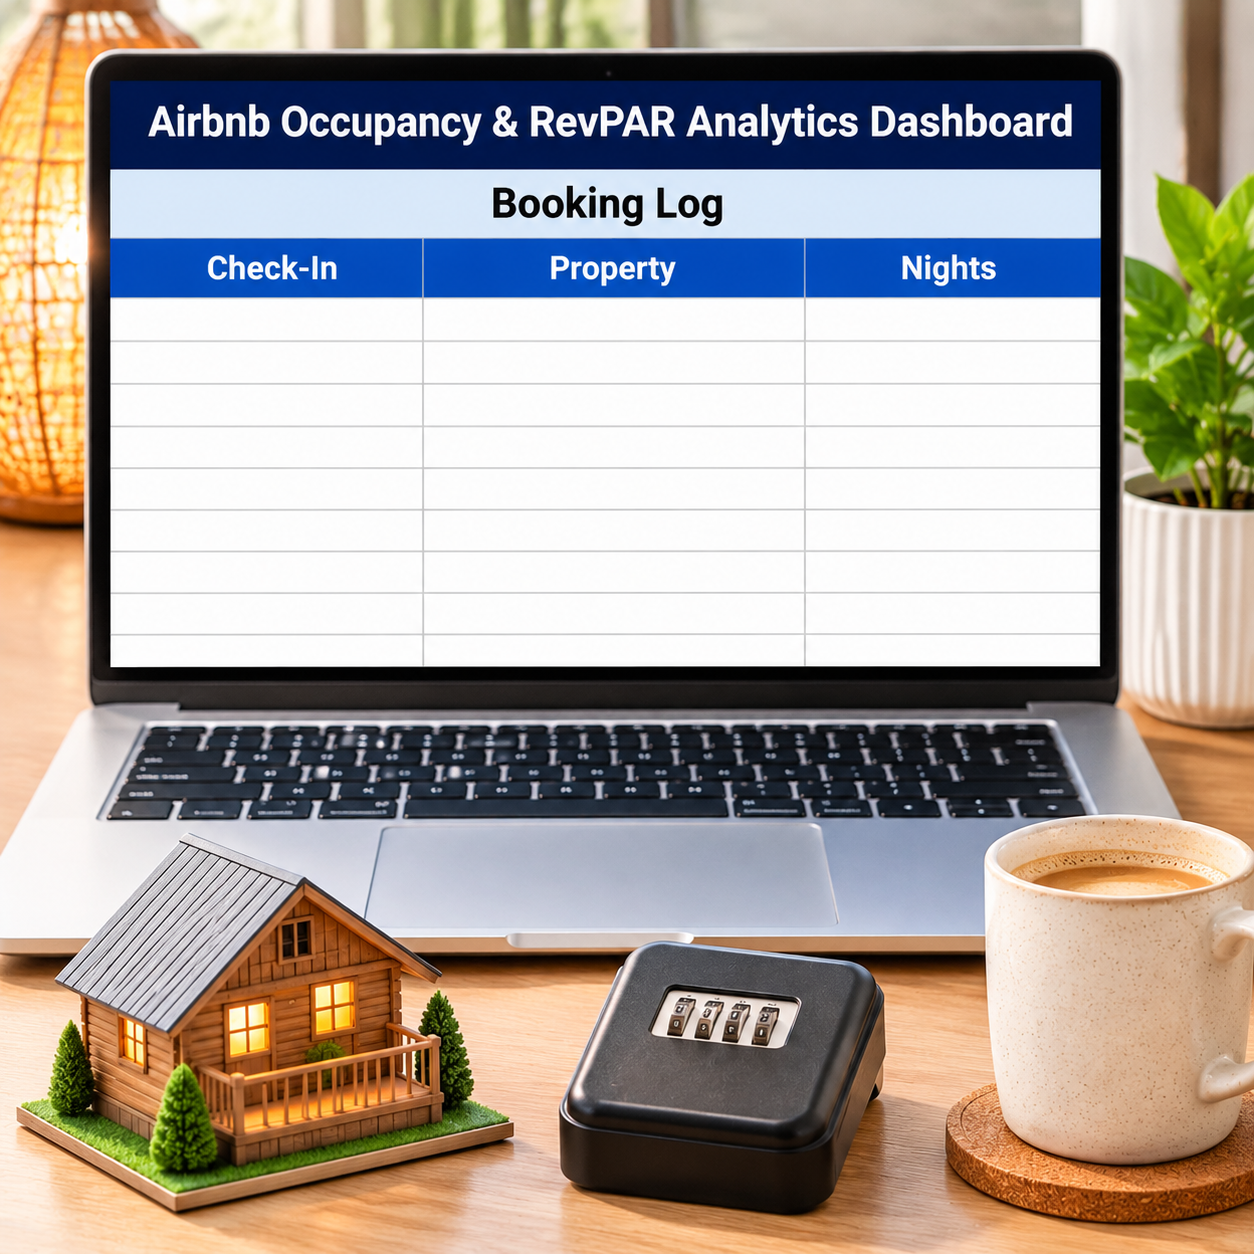
– Booking Log — 20 booking rows: check-in, property, channel, nights, rate, cleaning fee → gross, host fee, YOUR payout, cleaning profit; season totals + average length of stay
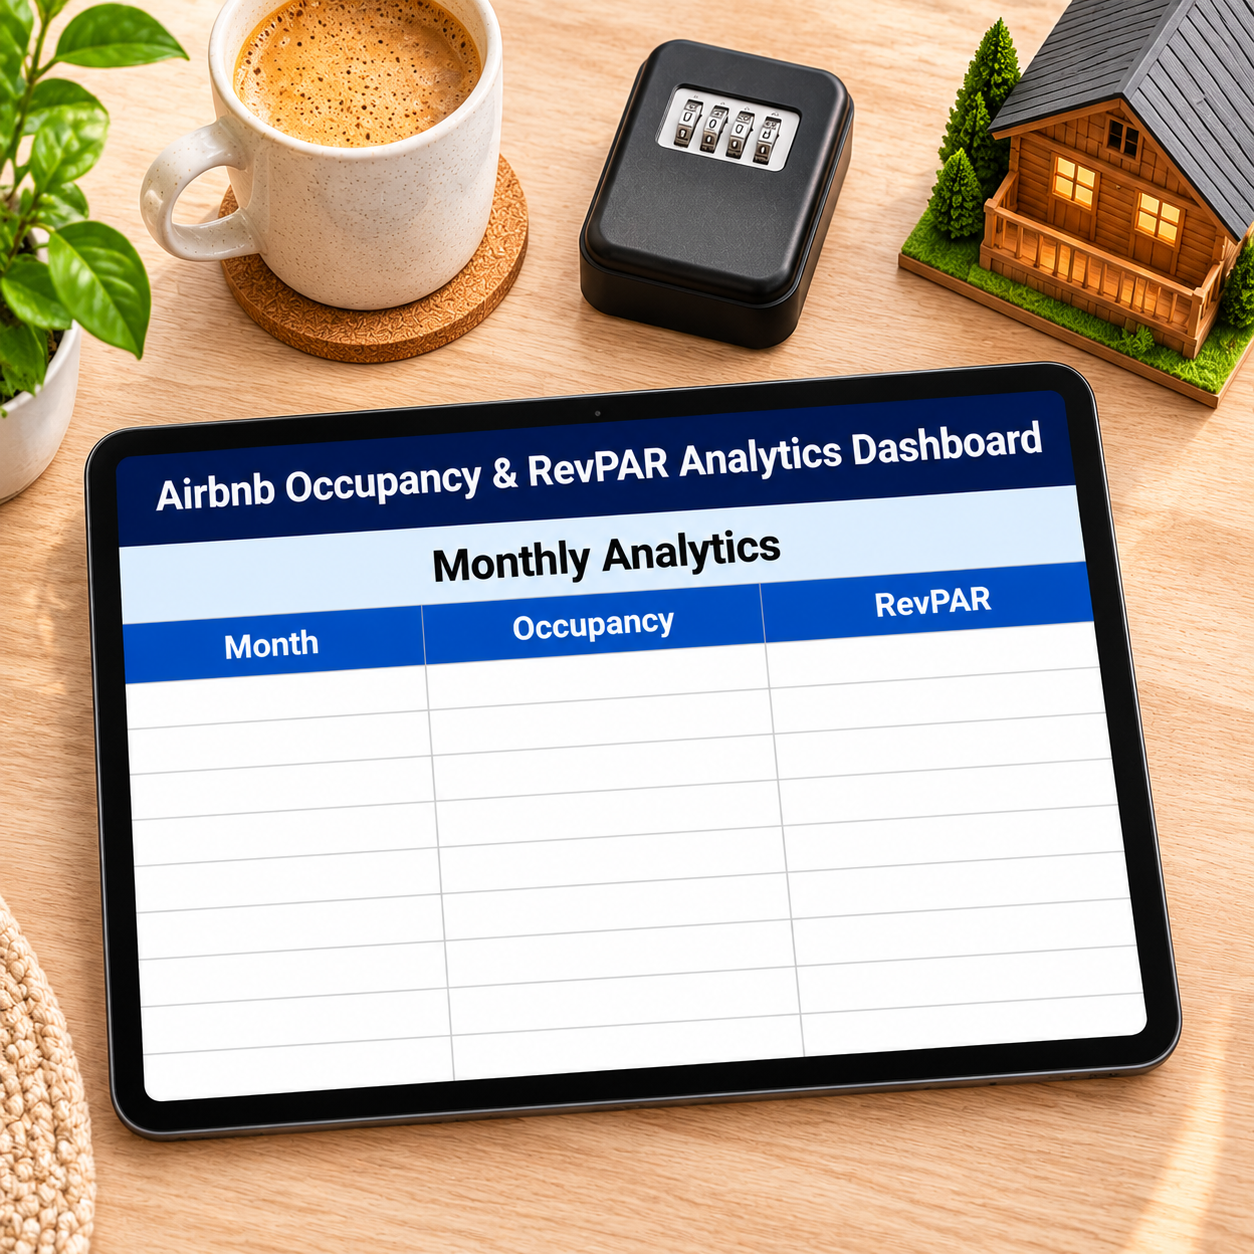
– Monthly Analytics — nights available in; occupancy, ADR, RevPAR by month and portfolio, target flags, by-property and by-channel roll-ups
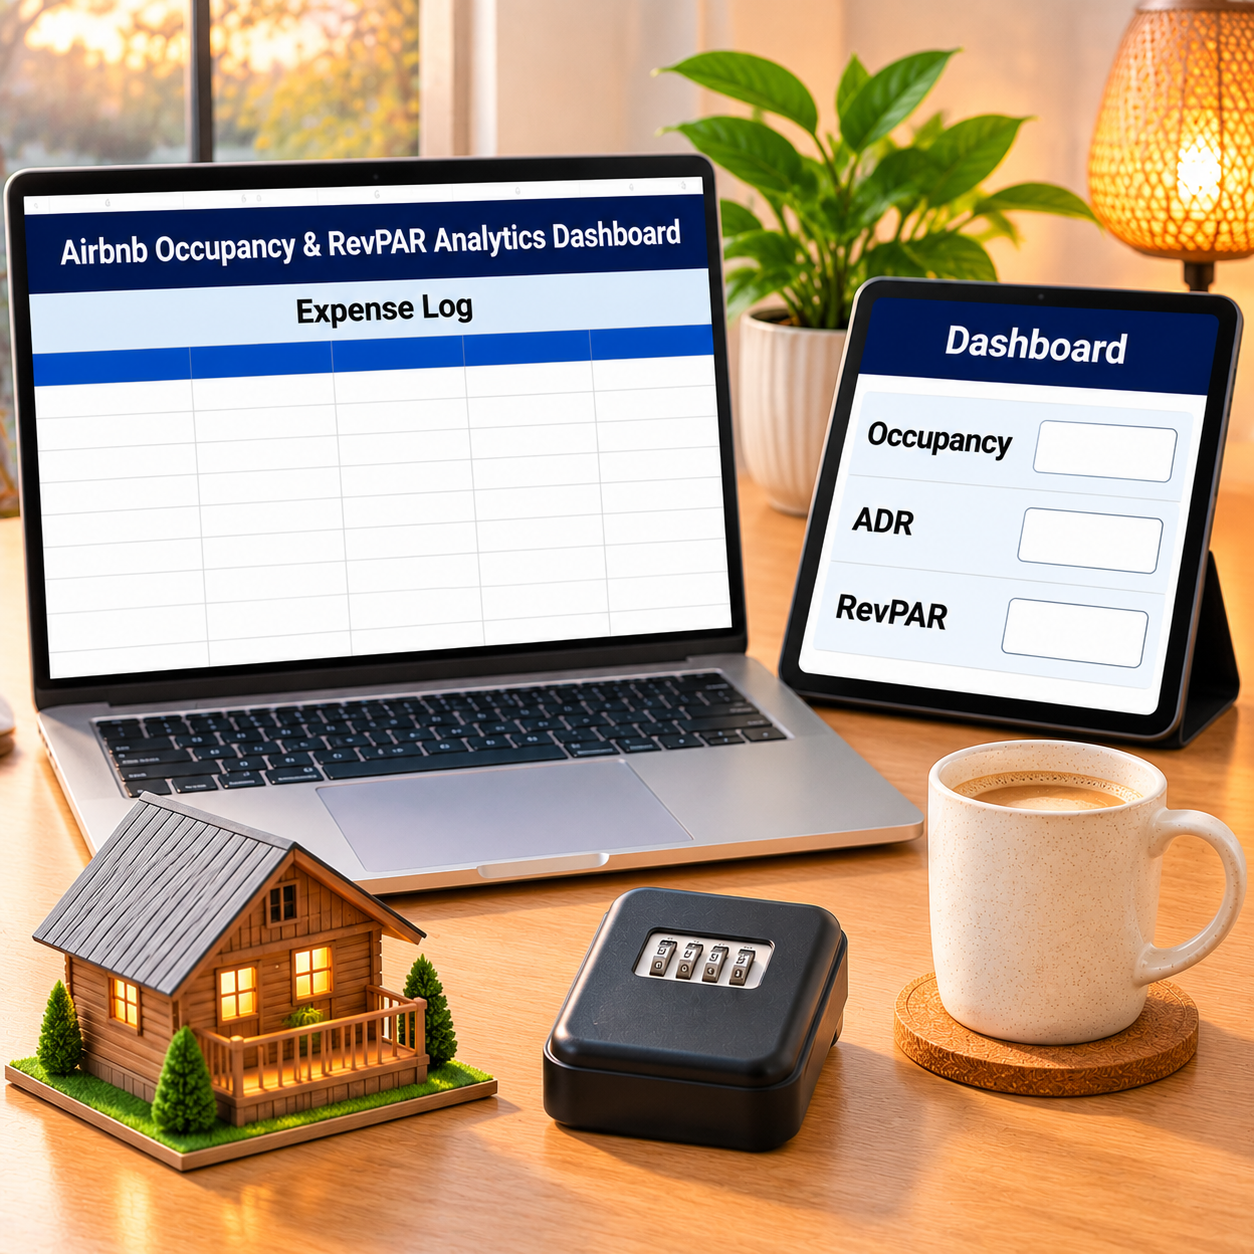
– Expense Log — running costs, categorized (cleaning supplies, restocking, utilities…)
– Monthly Budget — zero-based, Budget vs Actual fills itself
– Dashboard — occupancy, ADR, RevPAR, payout and cleaning profit on one screen
– Monthly Summary — spending by month, Jan–Dec
Instant download. Yellow cells are yours to type in; every formula cell is locked (password sheetdaily, shown in Start Here) so nothing breaks by accident. The sample season is pre-filled so you can see the math working — replace it with your own. The host fee percentage is an example setting, not a platform fact: check your account’s actual fee and update Start Here.




Reviews
There are no reviews yet.