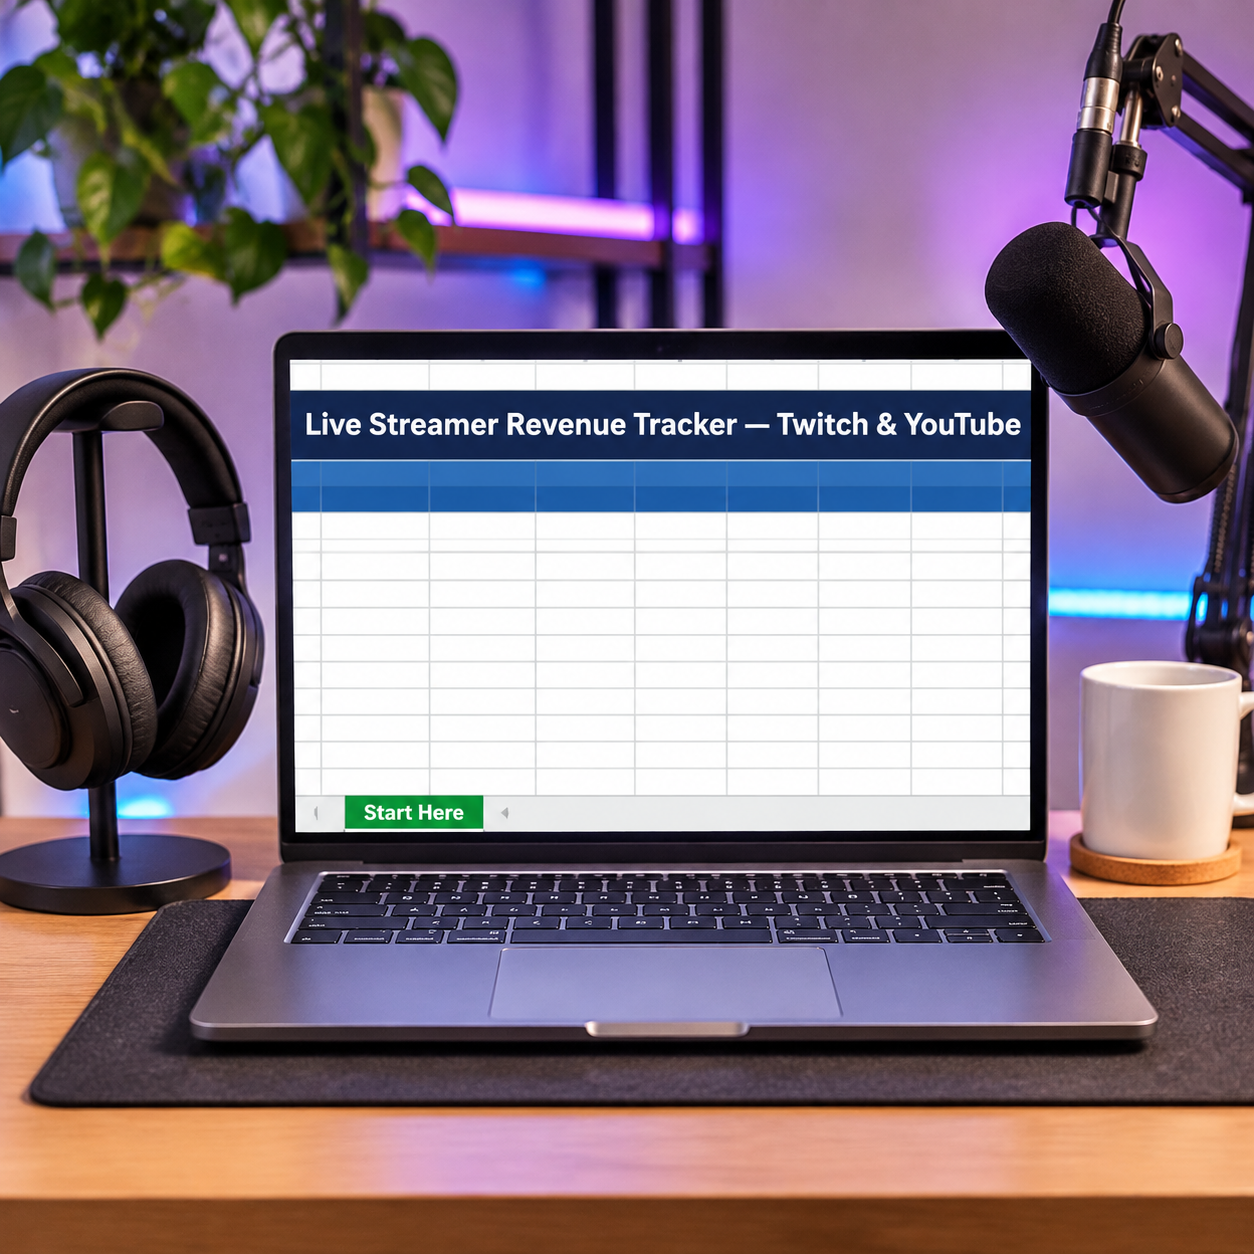

Your Twitch dashboard shows gross. Your YouTube dashboard shows gross. Neither shows what a stream actually paid YOU — after the platform’s cut of your subs and bits, the processor’s slice of donations, and your agency’s cut of the sponsorship — or what it paid per hour of your life. This tracker deducts the cuts by revenue type at YOUR example settings on every stream and ends each one with the only two numbers that rank a stream honestly: your NET, and your net per hour. The sample’s 8 streams: $2,202 gross becomes $1,546.95 net after $655.05 of cuts — $58.38 an hour blended, with YouTube quietly out-paying Twitch $69.72 to $50.32 an hour.
What it does for you:
– Cuts deducted by type, at YOUR rates: subs/bits on Twitch and memberships/ads on YouTube use each platform’s cut %; donations use your processor cut; sponsorships your agency cut (0% if you book direct). Every % is an example setting on Start Here — platforms change splits, so check yours and replace them.
– Net per hour on every stream: the sponsored showcase nets $372.75 at $93.19/hr; the 5-hour subathon nets $206 at $41.20/hr. Hype and hourly truth are finally in different columns.
– Payout thresholds, tracked per platform: each platform’s monthly net is set against its payout threshold (example settings — Twitch $50, YouTube $100) with a Still to Go figure and a Pays out ✓ / Held status, so money that will sit for another month is never a surprise.
– Revenue mix at a glance: the sample’s gross is 38.1% subs & memberships, 25.0% sponsorships, 16.2% ads, 10.5% bits, 10.3% donations — see what your channel actually lives on before you plan around the wrong stream type.
– Tax set-aside and the business around the streams: your example % of net totalled for you ($232.04 on the sample at 15%), a categorized expense log (gear, games, clips), and a zero-based monthly budget.
What’s inside (.xlsx, works in Excel AND Google Sheets):
– Start Here — plain-English setup + your settings (platform cut %s, donation and agency cuts, payout thresholds, tax set-aside % — all replaceable EXAMPLE settings)
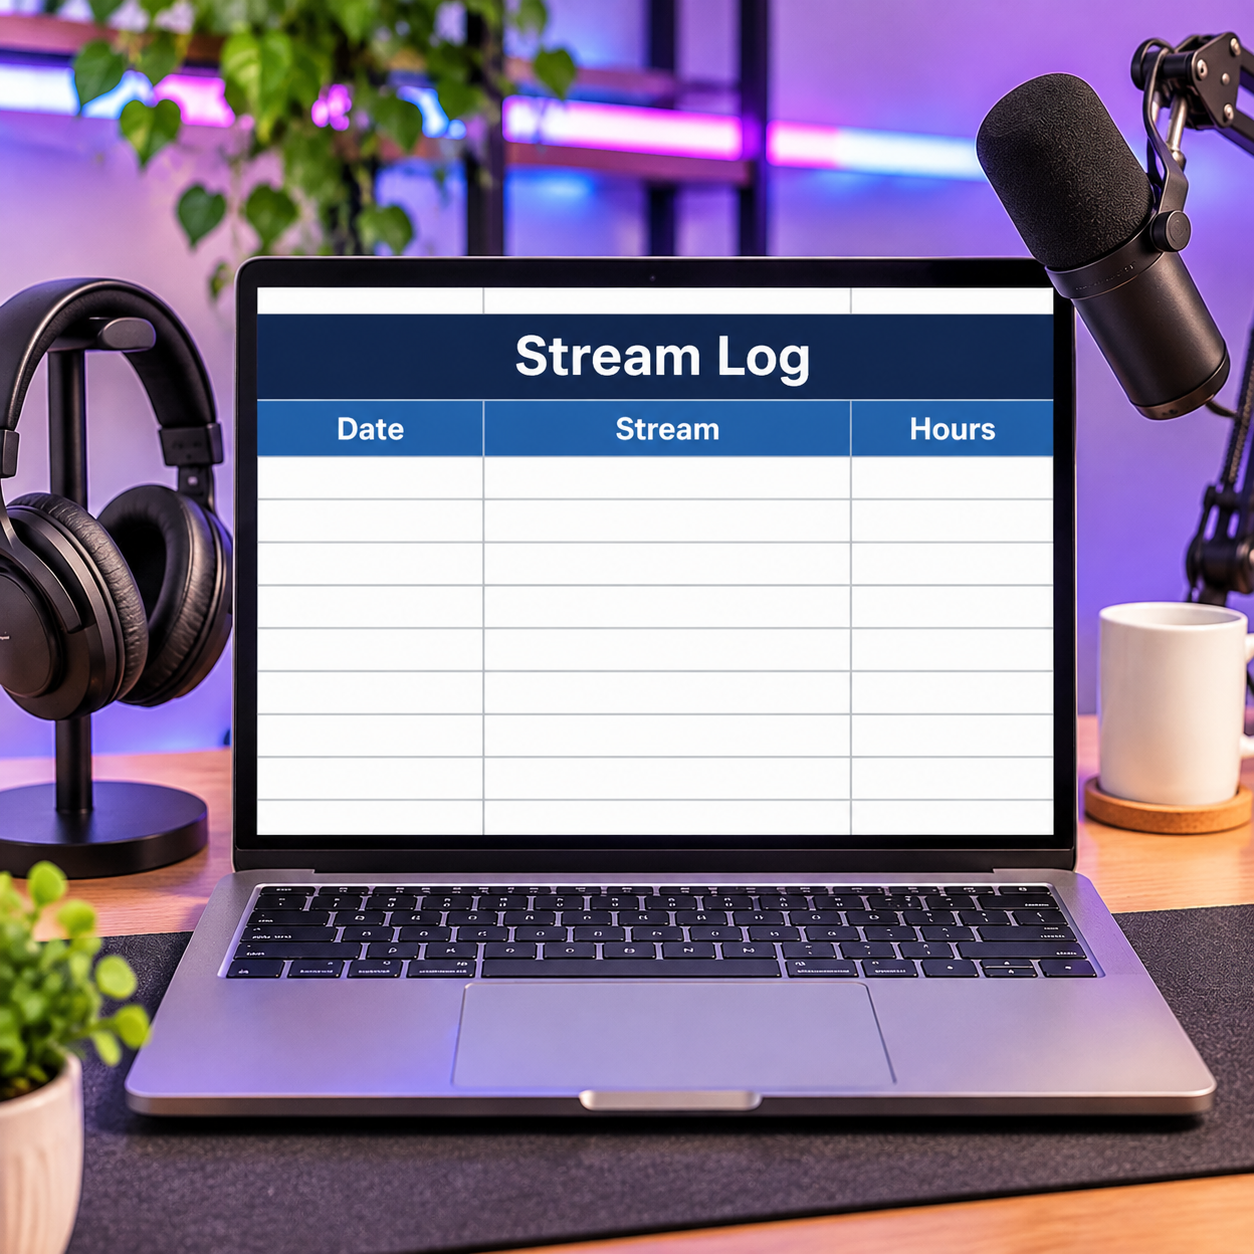
– Stream Log — 12 stream rows: date, platform, title, hours, subs, bits, donations, ads, sponsorships → gross, cuts, YOUR NET, net/hour
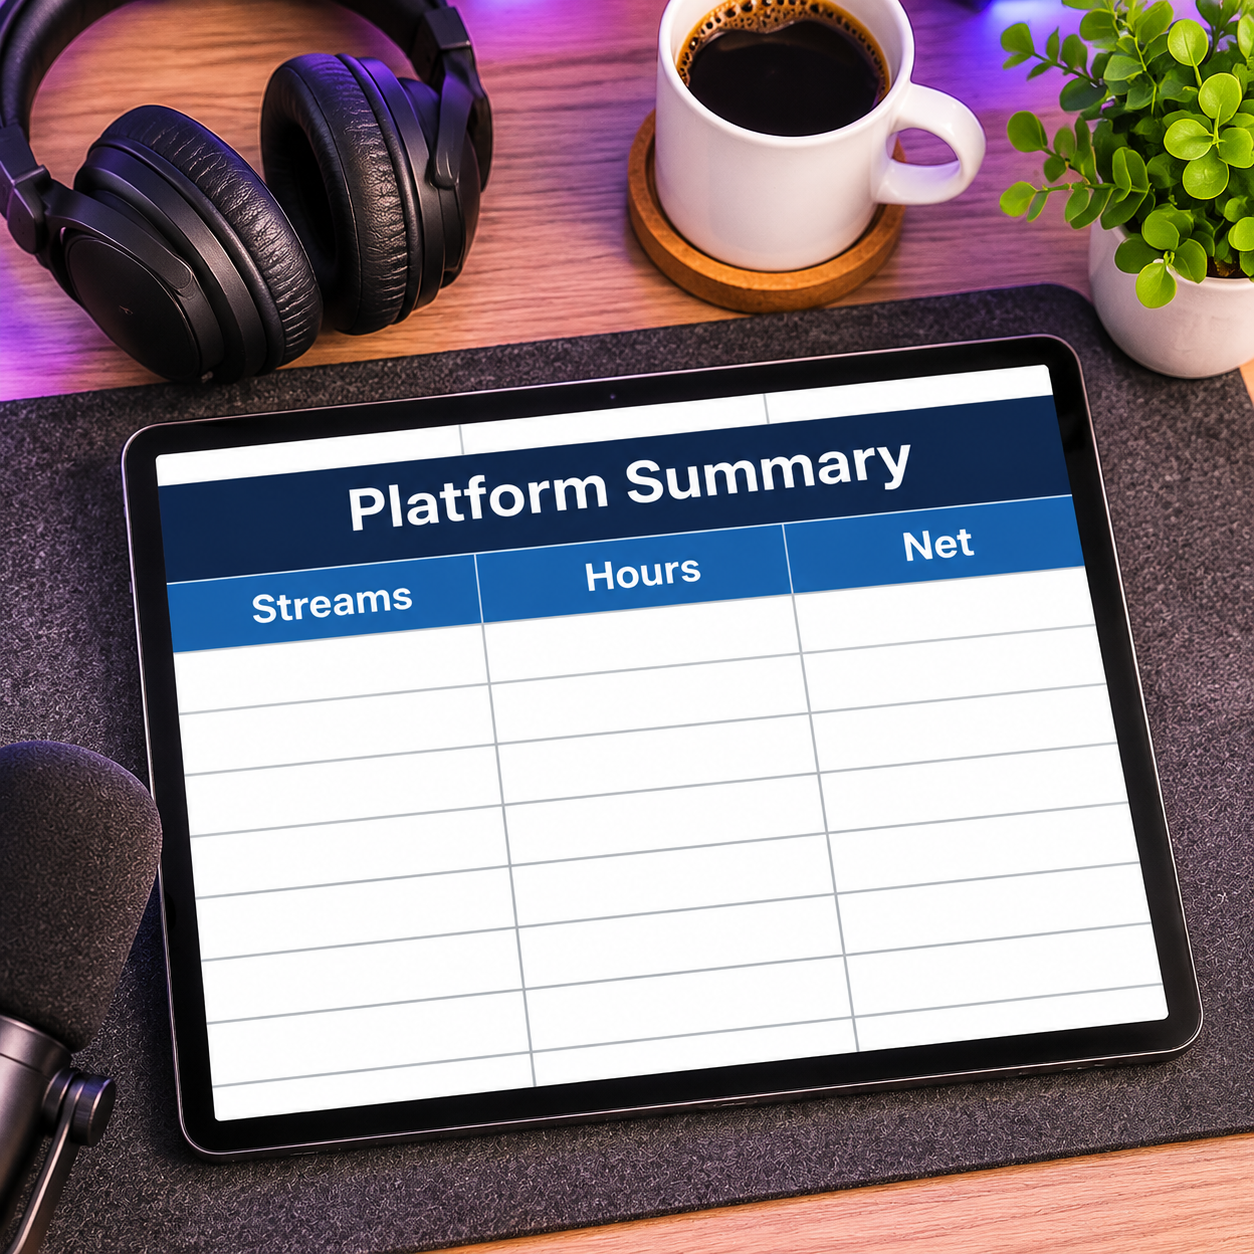
– Platform Summary — automatic per-platform roll-up vs payout threshold + gross by revenue type with shares
– Expense Log — business spending, categorized (gear & upgrades, games, marketing/clips…)
– Monthly Budget — zero-based, Budget vs Actual fills itself
– Dashboard — gross, cuts, net and blended net/hour on one screen
– Monthly Summary — spending by month, Jan–Dec
Instant download. Yellow cells are yours to type in; every formula cell is locked (password sheetdaily, shown in Start Here) so nothing breaks by accident. Sample streams are pre-filled so you can see the math working — replace them with your own. Platform cut percentages and payout thresholds are example settings, not official platform facts: check your channel’s actual split and thresholds and update Start Here.



Reviews
There are no reviews yet.