

Your highest-paying client might be your worst client. The $1,500 retainer looks like the star of the sample roster — until the hours go in: 40 of them, an effective $37.50 an hour, while the quiet $600 package client pays $54.55 an hour and the $850 retainer pays $35.42. This tracker puts every client — retainer, hourly, package — on one page and divides what they pay by the hours they actually take, so you can see your real rate per client and fix the roster with numbers, not feelings.
What it does for you:
– Effective $/hr for every client, automatically: hourly clients pay rate × hours; retainer and package clients pay their fee — and all three are divided by Hours Worked, so the retainer that quietly eats your month shows its true rate ($37.50, not “$1,500!”).
– A blended rate for the whole roster: the sample’s 8 clients pay $6,664 for 165 hours — $40.39 an hour blended, best client $54.55, lowest $35.00, all on one screen.
– The TRUE rate, including the invisible hours: add your admin / unbilled hours (18 a month in the sample) and the rate drops to $36.42 — the number your business actually earns, and the one your prices should be set from.
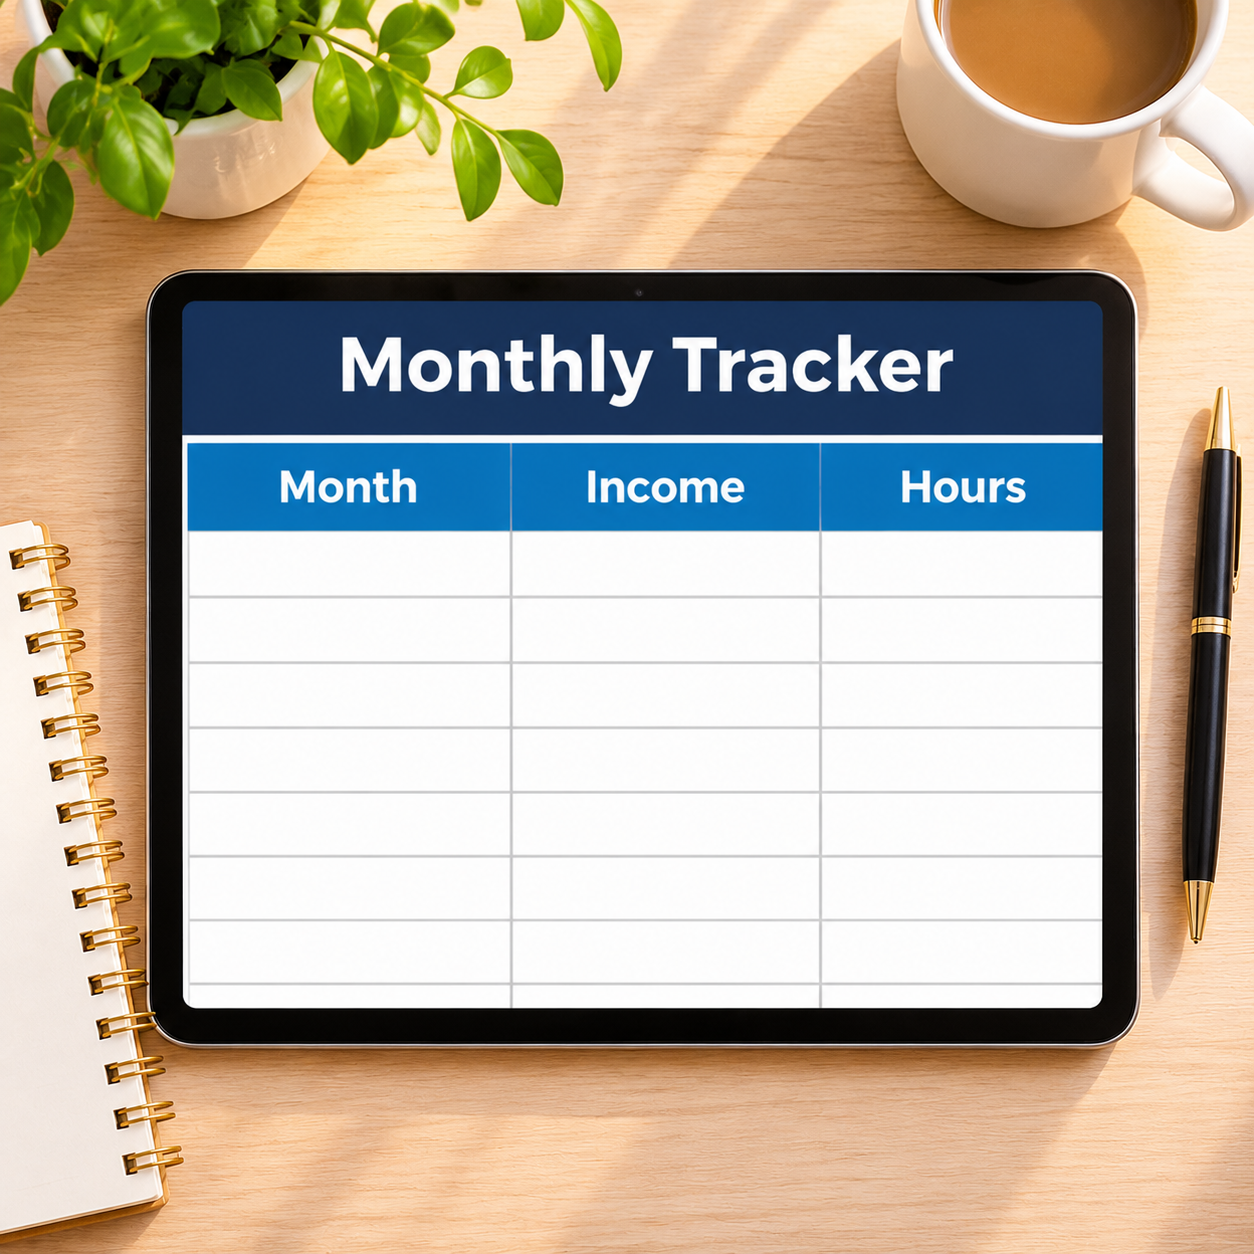
– A year that shows its trend: the Monthly Tracker logs income and hours per month (Jul $5,480 at $37.03/hr → Oct $6,664 at $40.39/hr) and flags every month against your target income — watch the rate climb as you replace low-value hours.
– The roster decision, made easy: when a client asks for more hours, the Dashboard already knows what their hours are worth — and what to charge the next one.
What’s inside (.xlsx, works in Excel AND Google Sheets):
– Start Here — plain-English setup + your settings (target monthly income, admin / unbilled hours)
– Client Income — every client with type, rate/fee, hours, income and effective $/hr, plus the blended / best / lowest / TRUE rate summary
– Monthly Tracker — income, hours, effective rate, vs-target gap and status for 12 months
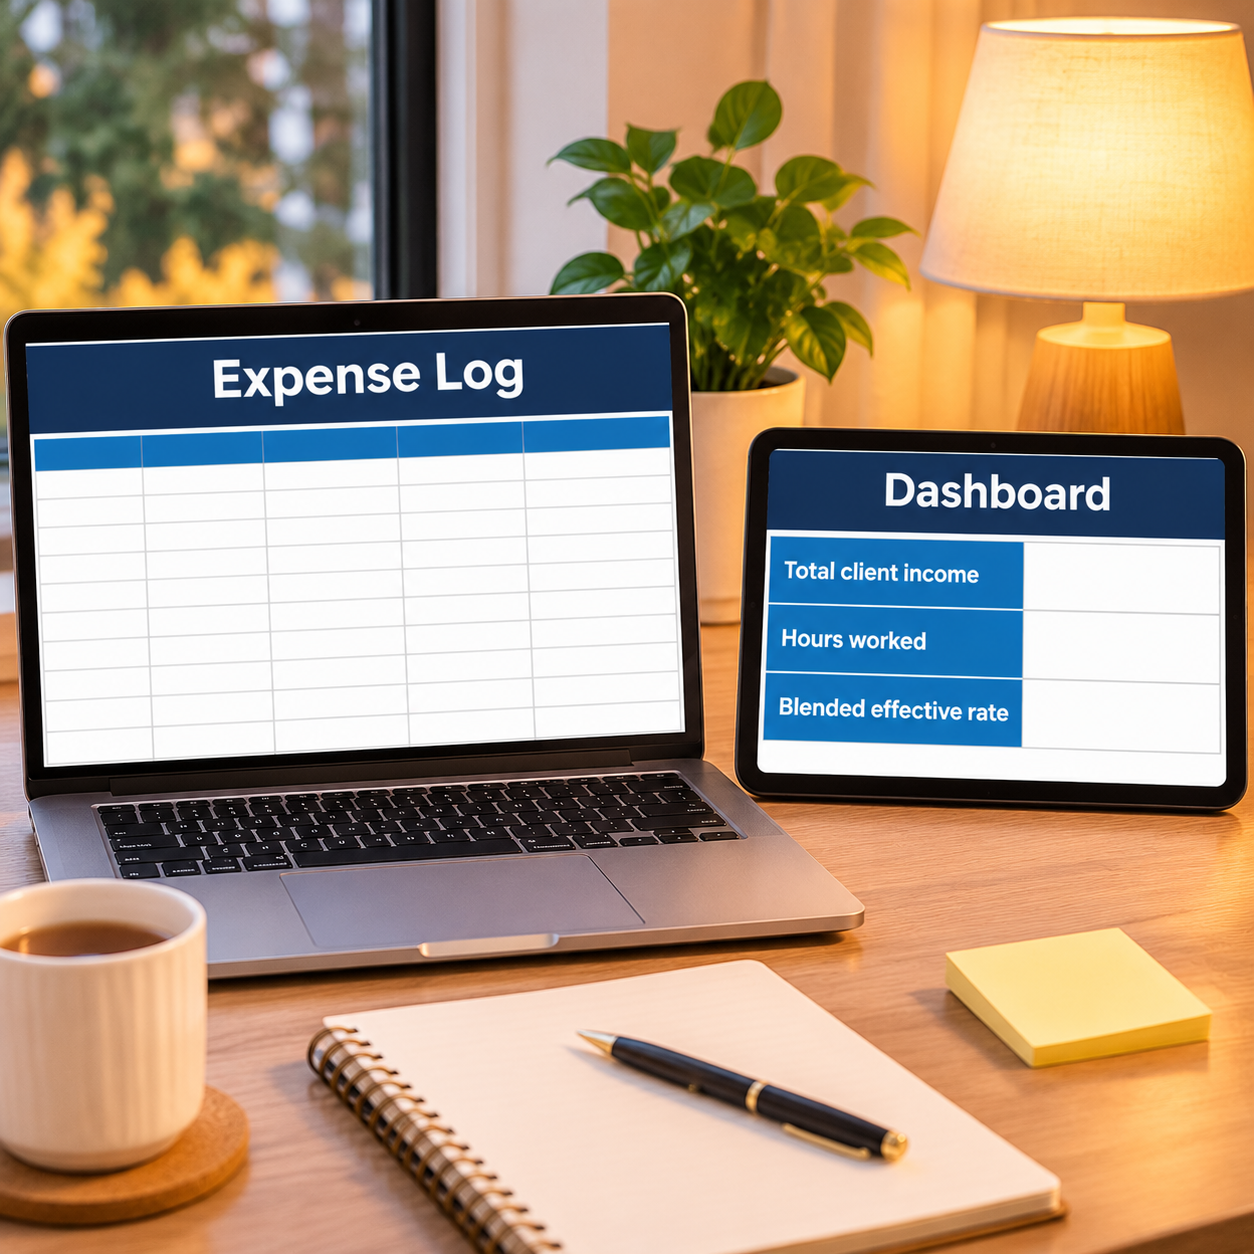
– Expense Log — business spending, categorized
– Monthly Budget — zero-based, Budget vs Actual fills itself
– Dashboard — the whole roster on one screen
– Monthly Summary — spending by month, Jan–Dec
Instant download. Yellow cells are yours to type in; every formula cell is locked (password sheetdaily, shown in Start Here) so nothing breaks by accident. A sample 8-client roster is pre-filled so you can see the rate math working — replace it with your own clients.




Reviews
There are no reviews yet.