A coffee cart lives or dies one drink at a time, and the drink that looks most profitable is often not. This calculator works per drink: what each drink on your menu costs to make — beans, milk, cup / lid / sleeve, syrup & extras, all typed by you — and what each drink earns at the menu price you type.
Day-by-day takings are a different tool’s job (the Food Truck Daily Sales Tracker logs a truck’s days; this calculator never logs a day’s sales). And if you are tracking your own coffee-shop spending as a customer, that is the Coffee Shop Spending Tracker — this one stands on the seller’s side of the counter.
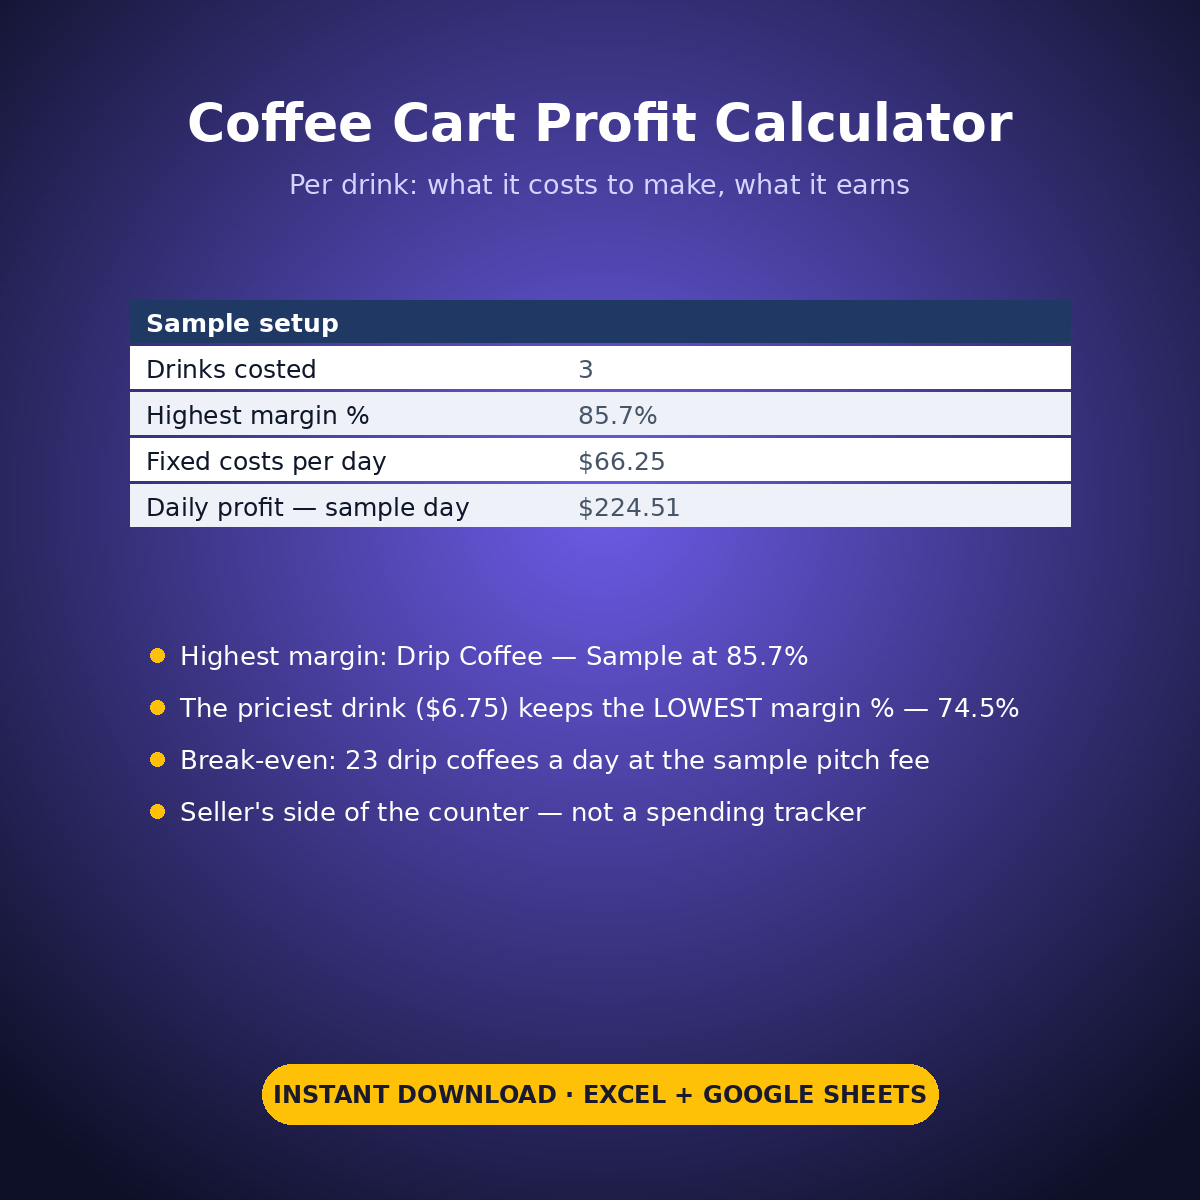
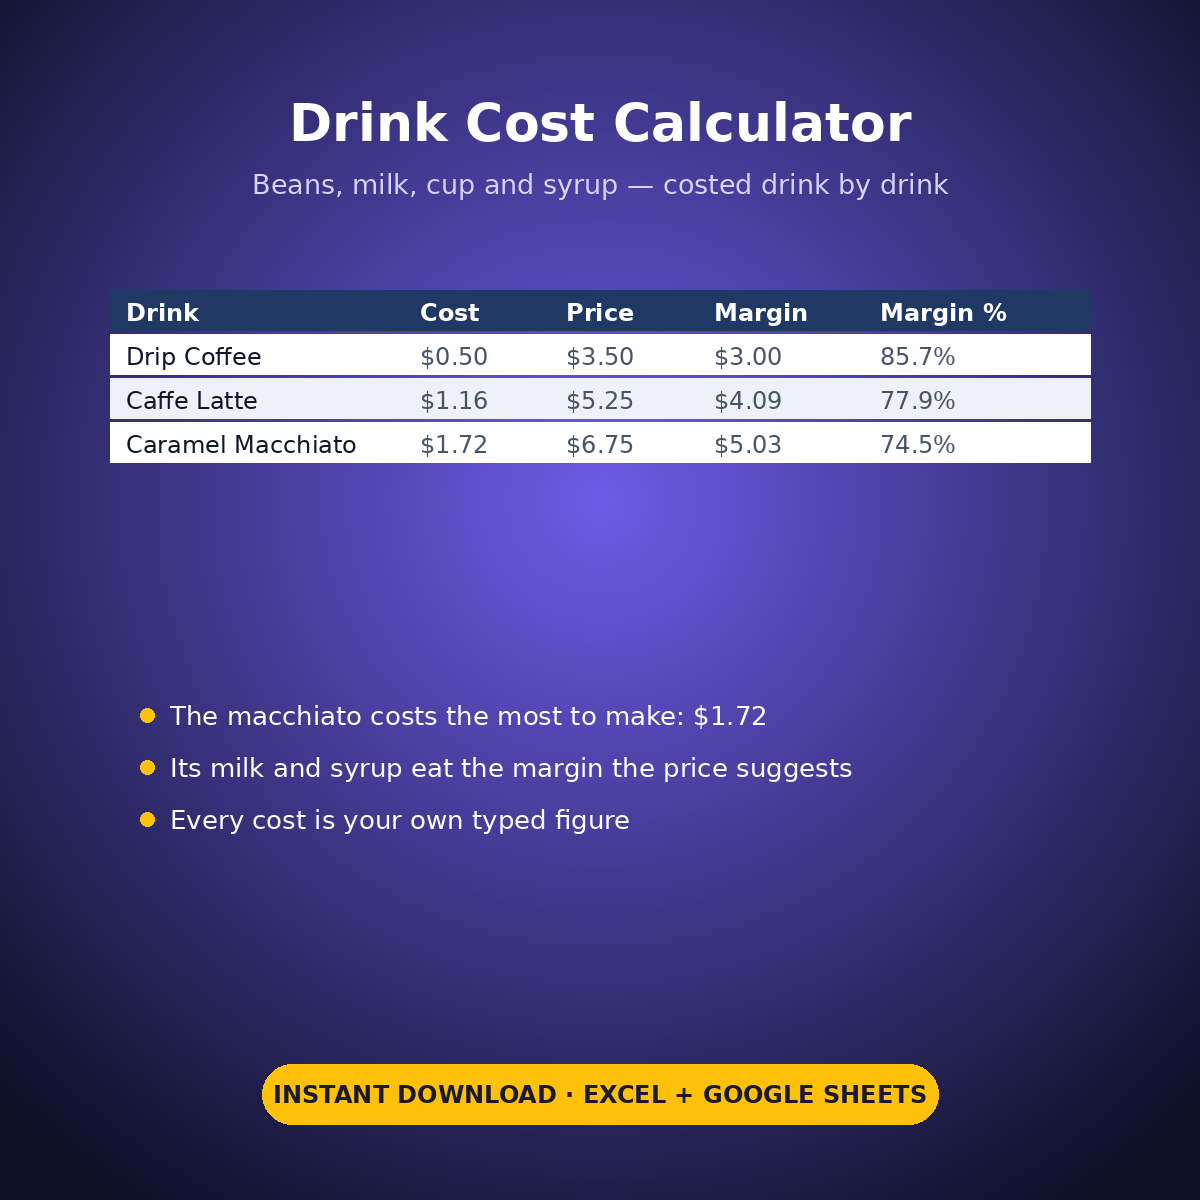
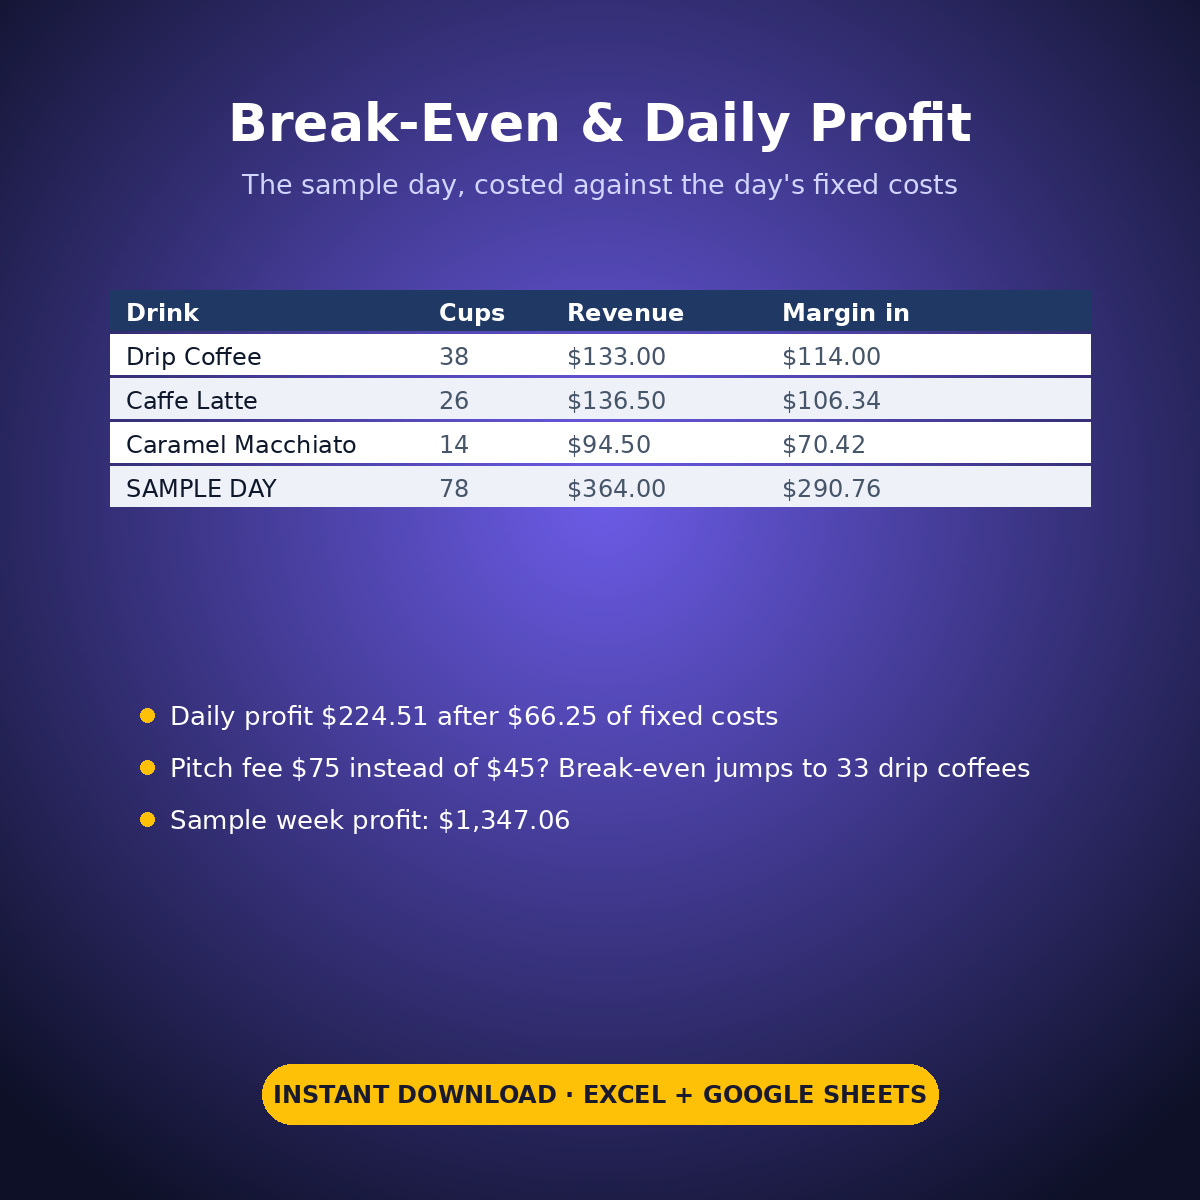
The sample menu makes the point plainly. The Caramel Macchiato carries the highest price on the menu, $6.75 — and the LOWEST margin %, 74.5%, because its milk and syrup costs ($1.72 a drink) eat the difference. The plain Drip Coffee costs $0.50, sells at $3.50 and keeps 85.7%. Break-even prints per drink against the typed day’s fixed costs of $66.25 (a $45.00 pitch fee, $12.50 fuel, $8.75 supplies): 23 drip coffees, 17 lattes or 14 macchiatos a day — and the notes show the second state too, because at a $75.00 pitch fee the fixed costs become $96.25 and the same arithmetic needs 33 drip coffees. The sample day sells 78 cups for $364.00 of revenue and $290.76 of gross margin — $224.51 of daily profit after the fixed costs.
HOW IT WORKS
– ‘Drink Cost Calculator’: one row per drink — beans, milk, cup / lid / sleeve and syrup & extras as typed per-drink costs, plus your typed menu price. Cost per drink, margin per drink and margin % calculate per drink.
– ‘Break-Even & Daily Profit’: type the day’s fixed costs once (pitch fee, fuel, supplies — your own figures). Break-even cups per day = fixed costs / that drink’s own margin, printed per drink type.
– The daily profit check: your typed cups sold per drink, totalled into the day’s gross margin, minus the same fixed costs, printed as the day’s profit (and a sample-week figure from your typed trading days).
WHAT’S INSIDE
– A per-drink cost build with margin $ and margin % printed per drink
– The honest surprise, printed: the priciest drink can carry the lowest margin % (sample: $6.75 at 74.5%)
– Break-even cups per day per drink type, from each drink’s own margin
– A break-even sensitivity shown in the sample notes — raise the pitch fee and the cups figure moves ($45 → 23 cups, $75 → 33 cups)
– A daily profit check from typed cups sold (sample day: $224.51)
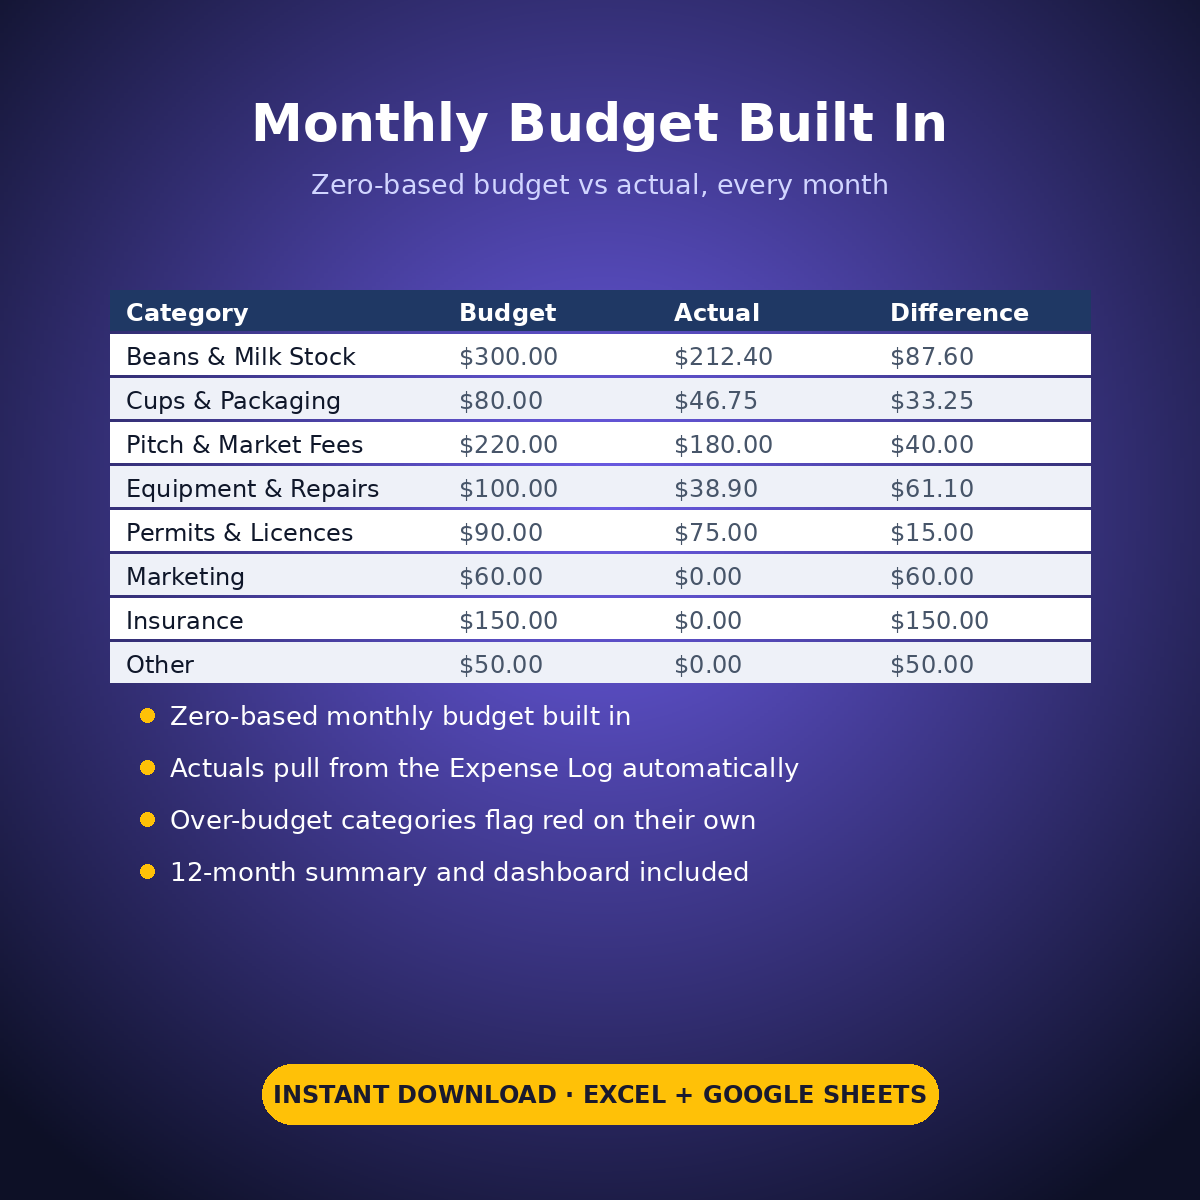
– Plus the standard Expense Log, zero-based Monthly Budget, Dashboard and Monthly Summary tabs
Every bean cost, milk cost, price and fee in this workbook is an example setting you type — the sheet does arithmetic on your figures only, and never tells you what to charge.
How it works: the seven tabs are Start Here (your settings + step-by-step), the two feature tabs, Expense Log, Monthly Budget (zero-based), Dashboard and Monthly Summary. Yellow cells are the only places you type — every yellow value is your own entry. Formula cells are locked (password: sheetdaily, disclosed on the Start Here tab) and every formula is error-wrapped, so an untouched sheet reads blank instead of showing error codes. Instant download, ready for Excel and Google Sheets.
A note on the sample data: every price and date in this workbook is example data, typed in by hand to show you how the sheet behaves. Replace it with your own.




Reviews
There are no reviews yet.