A food truck does not have good weeks and bad weeks — it has good DAYS and bad days, and they happen at different spots. This tracker works at the level of the trading day: one row per day, what the day took in cash and card, what the day itself cost to run, and what the day actually netted — rolled up by location so the spots can be compared honestly.
It never costs a single menu item. Per-drink unit costing for a coffee cart is the Coffee Cart Profit Calculator — this tracker stays at the level of the day, and the two share no figures.
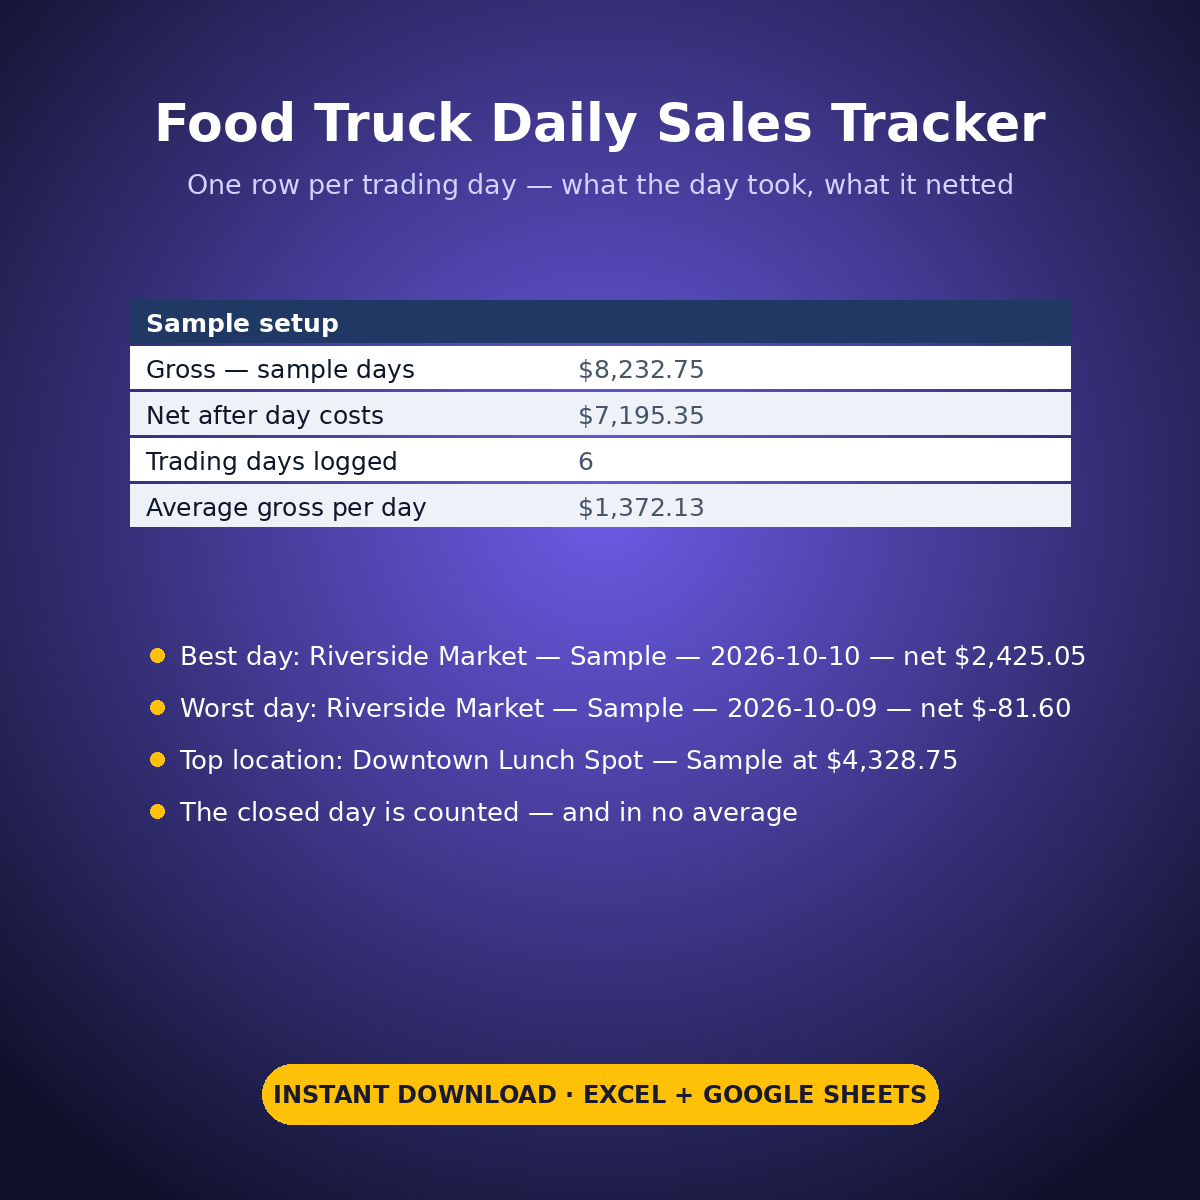
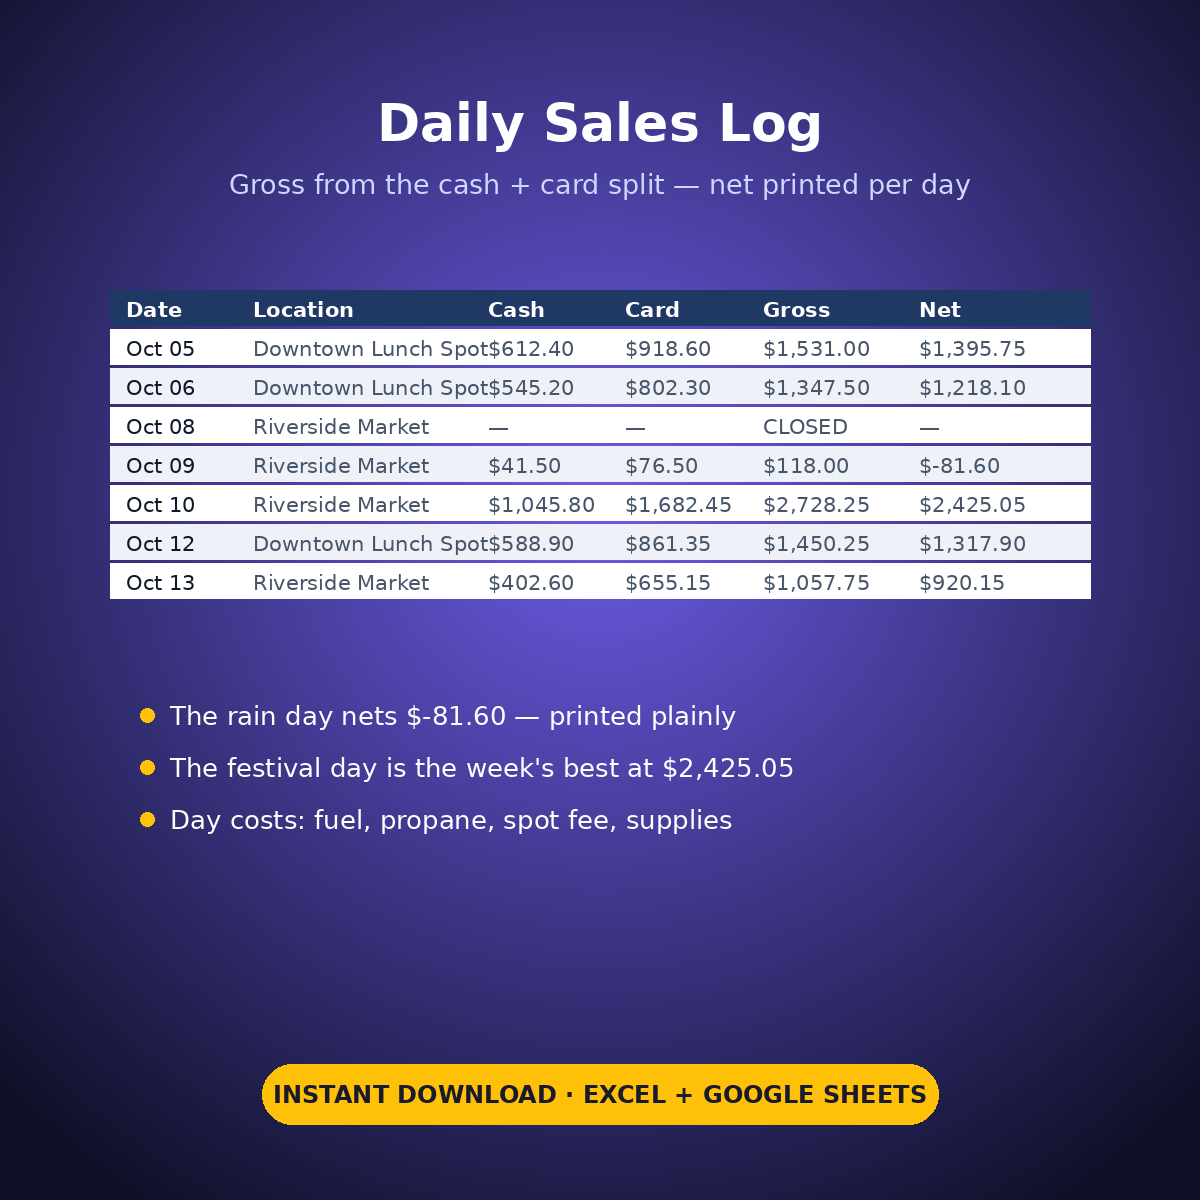
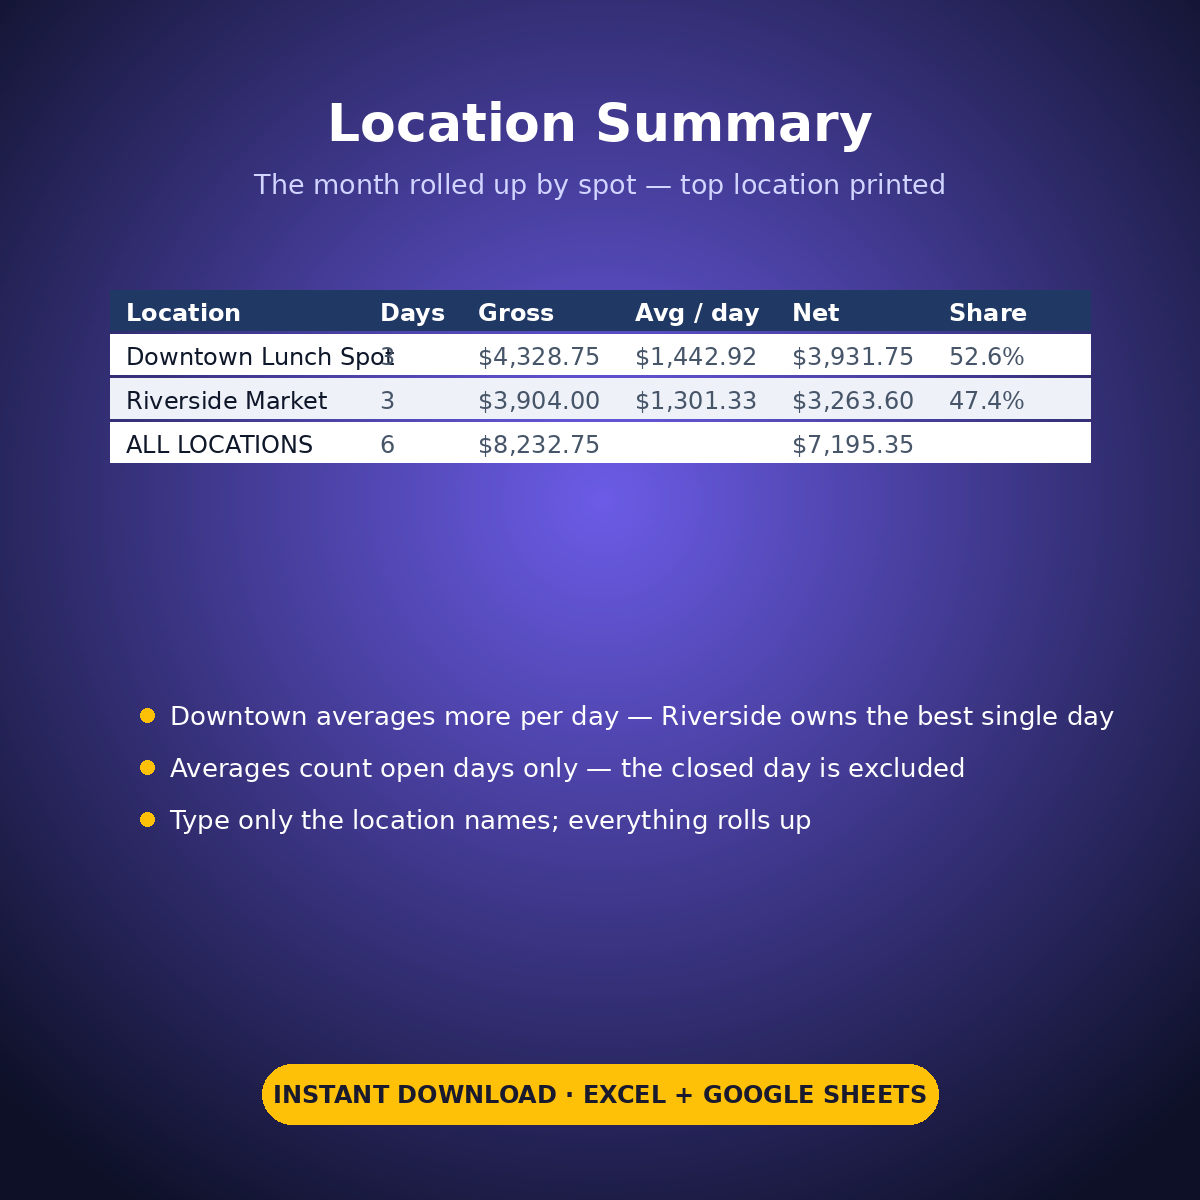
The sample runs 6 trading days across 2 locations, plus 1 closed day. Gross across the open days is $8,232.75 against $1,037.40 of day costs — net $7,195.35, an average of $1,372.13 gross per trading day. The sample hides nothing: the October 9 rain day at Riverside Market took $118.00 and paid out $199.60 in day costs, so it nets -$81.60, printed plainly. The October 10 festival day at the same spot is the week’s best at $2,425.05 net. Downtown Lunch Spot is the top location overall at $4,328.75 gross (52.6% of the take, $1,442.92 a day) against Riverside’s $3,904.00 — and the closed day sits in the log, counted as closed, and in no average anywhere.
HOW IT WORKS
– ‘Daily Sales Log’: one row per day — date, location or event in your own words, status (Open / Closed), cash and card takings typed separately, items sold. Gross is totalled from the cash + card split only. The day’s own costs (fuel, propane, commissary / spot fee, supplies) print the day’s net.
– ‘Location Summary’: type only the location names. Days traded, total gross, average gross per day and total net roll up per location, with the top location printed.
– The printed lines: the week’s best and worst days by location name, the trading-day average with closed days excluded, and the closed-day count itself.
WHAT’S INSIDE
– A day-level sales log with the gross built from the cash / card split only
– A per-day cost block (fuel, propane, spot fee, supplies) and a printed net per day — negative days included (sample: -$81.60)
– A location roll-up with average gross per day per spot and the top location printed (sample: $4,328.75)
– Best and worst days printed by location name from your own numbers
– Closed days kept in the log and excluded from every average and total
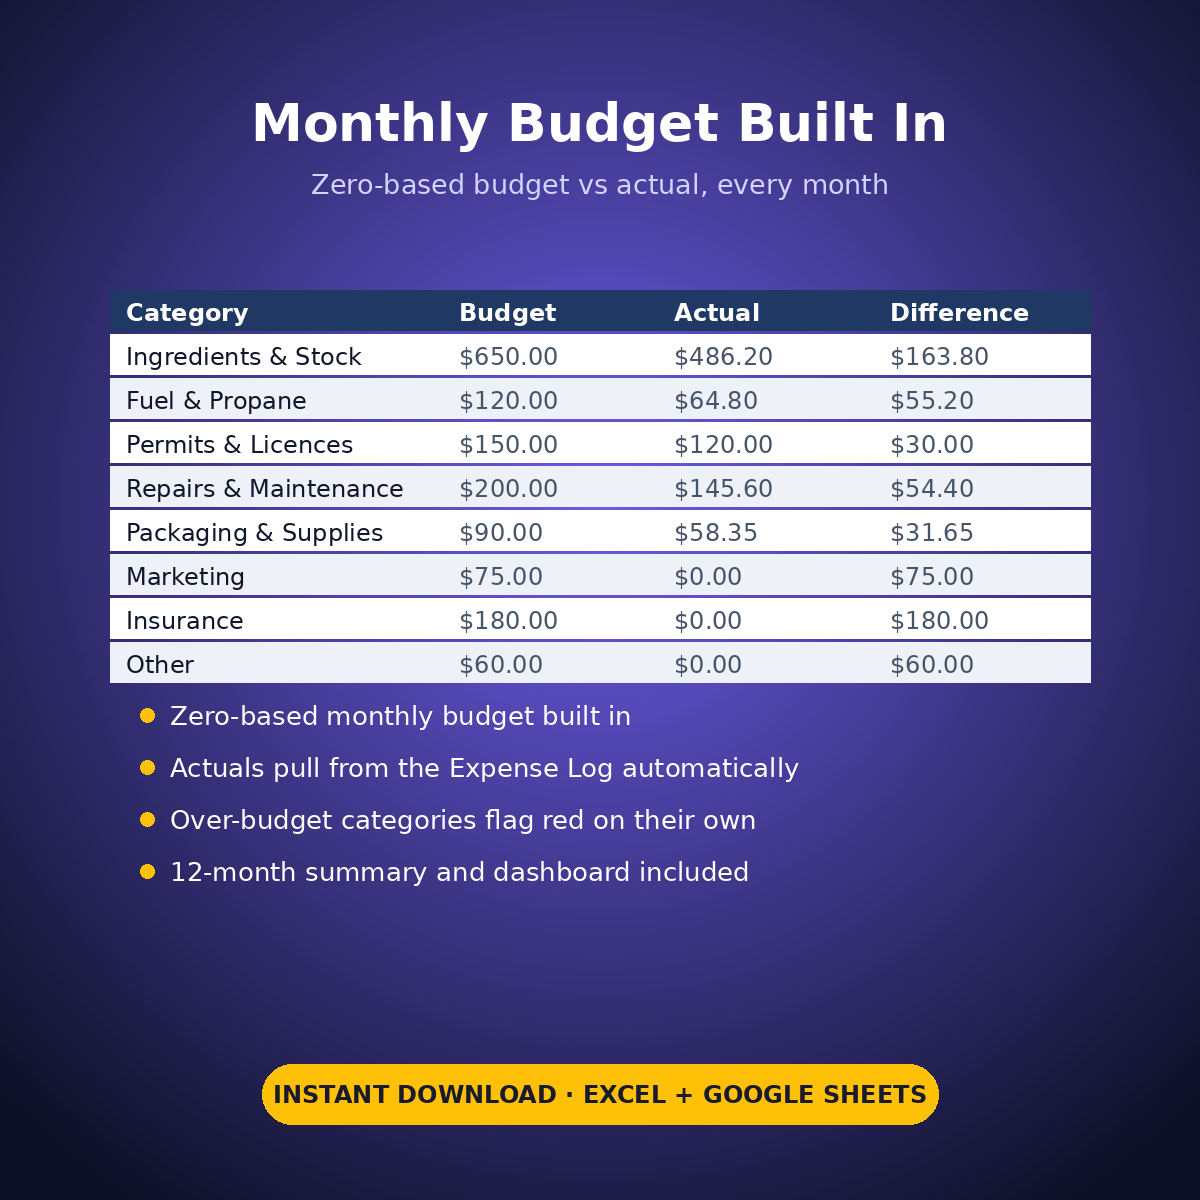
– Plus the standard Expense Log, zero-based Monthly Budget, Dashboard and Monthly Summary tabs
Every price, fee and cost in this workbook is an example setting you type — the sheet sets no prices and recommends nothing.
How it works: the seven tabs are Start Here (your settings + step-by-step), the two feature tabs, Expense Log, Monthly Budget (zero-based), Dashboard and Monthly Summary. Yellow cells are the only places you type — every yellow value is your own entry. Formula cells are locked (password: sheetdaily, disclosed on the Start Here tab) and every formula is error-wrapped, so an untouched sheet reads blank instead of showing error codes. Instant download, ready for Excel and Google Sheets.
A note on the sample data: every price and date in this workbook is example data, typed in by hand to show you how the sheet behaves. Replace it with your own.




Reviews
There are no reviews yet.