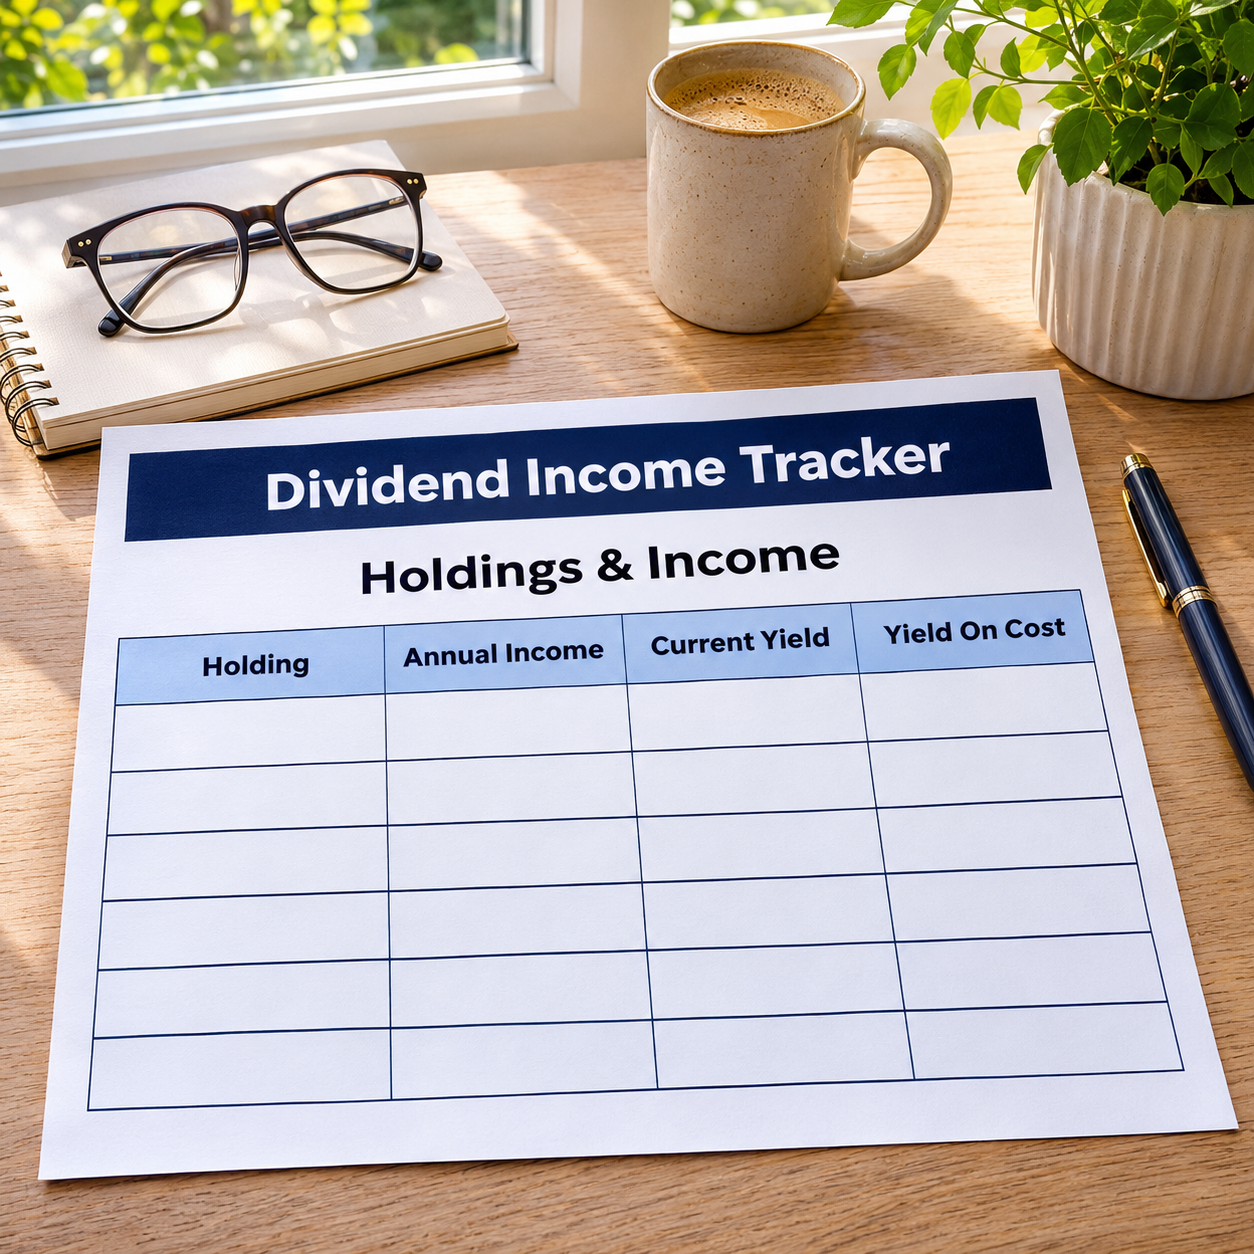
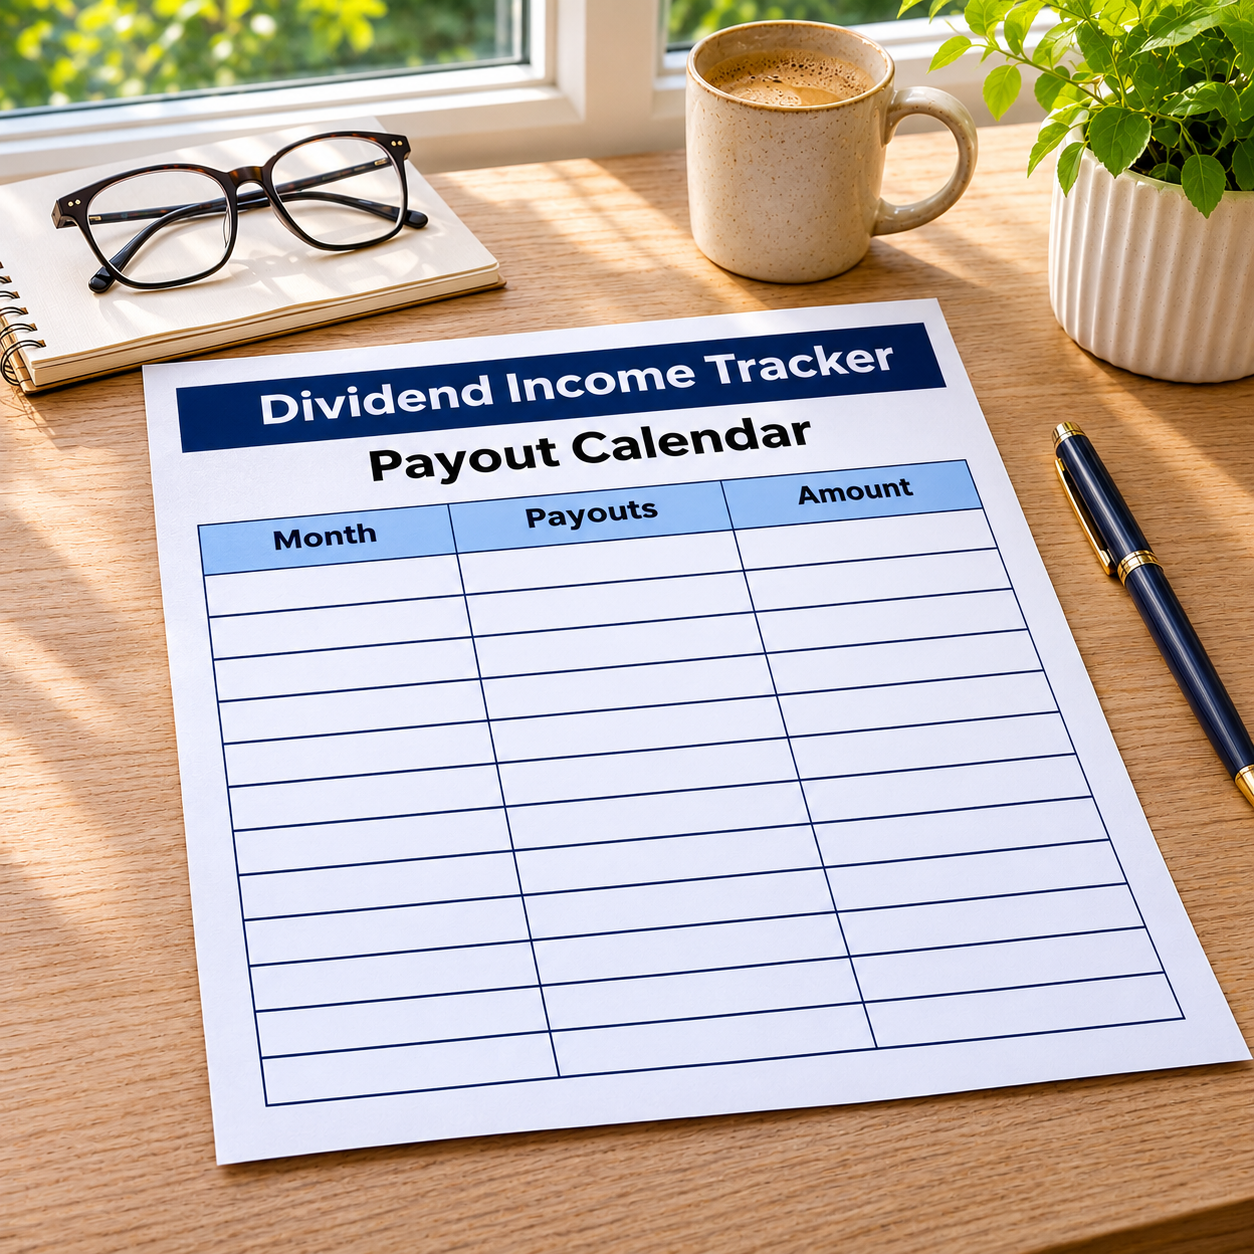
A dividend portfolio has two stories: how much it pays, and when. Most trackers tell only the first. This one tells both — every holding’s income, both yields side by side, and a 12-month payout calendar built from the payment months you type, so the fat months and the lean months are visible before they surprise you.
Start with the holdings: shares, your average cost, today’s price — typed by hand. Manual entry is stated plainly on the sheet: there is no price feed in this file and none is claimed, so the yields are exactly as fresh as the prices you last typed. The sample’s 9 holdings pay $3,308.60 a year on $94,130.00 of market value, a 3.5% blended yield. Every line shows current yield AND yield on cost, because the yield you locked in and the yield a new buyer gets today are different numbers and both matter.
The $0 line stays visible: the sample’s growth stock pays no dividend and shows $0.00 of income, counted in the sheet’s “paying $0” line. An income portfolio should show its non-payers, not hide them inside an average.
Then the calendar. The same $3,308.60, arriving month by month: December pays $489.00, when the quarterly payers and the one annual payer land together; February, May, August and November pay $224.90. The average month ($275.72) is a fiction no actual month pays — and the calendar proves its own total against the holdings tab, to the cent, with a check that must read $0.00.
The DRIP example at the bottom is labelled what it is: with reinvestment on and dividends growing at an EXAMPLE 5%, the income line reaches $5,389.36 a year in 10 years — two generous assumptions stacked, a ceiling to think with, never a forecast.
What it does for you:
– Tracks income per holding with current yield AND yield on cost on every line
– Builds a true 12-month payout calendar from the payment months you type per holding
– Shows the fat and lean months ($489.00 December vs $224.90 lean months in the sample)
– Keeps $0 payers visible and counted instead of averaging them away
– Self-checks: the calendar total must equal the holdings total, to the cent
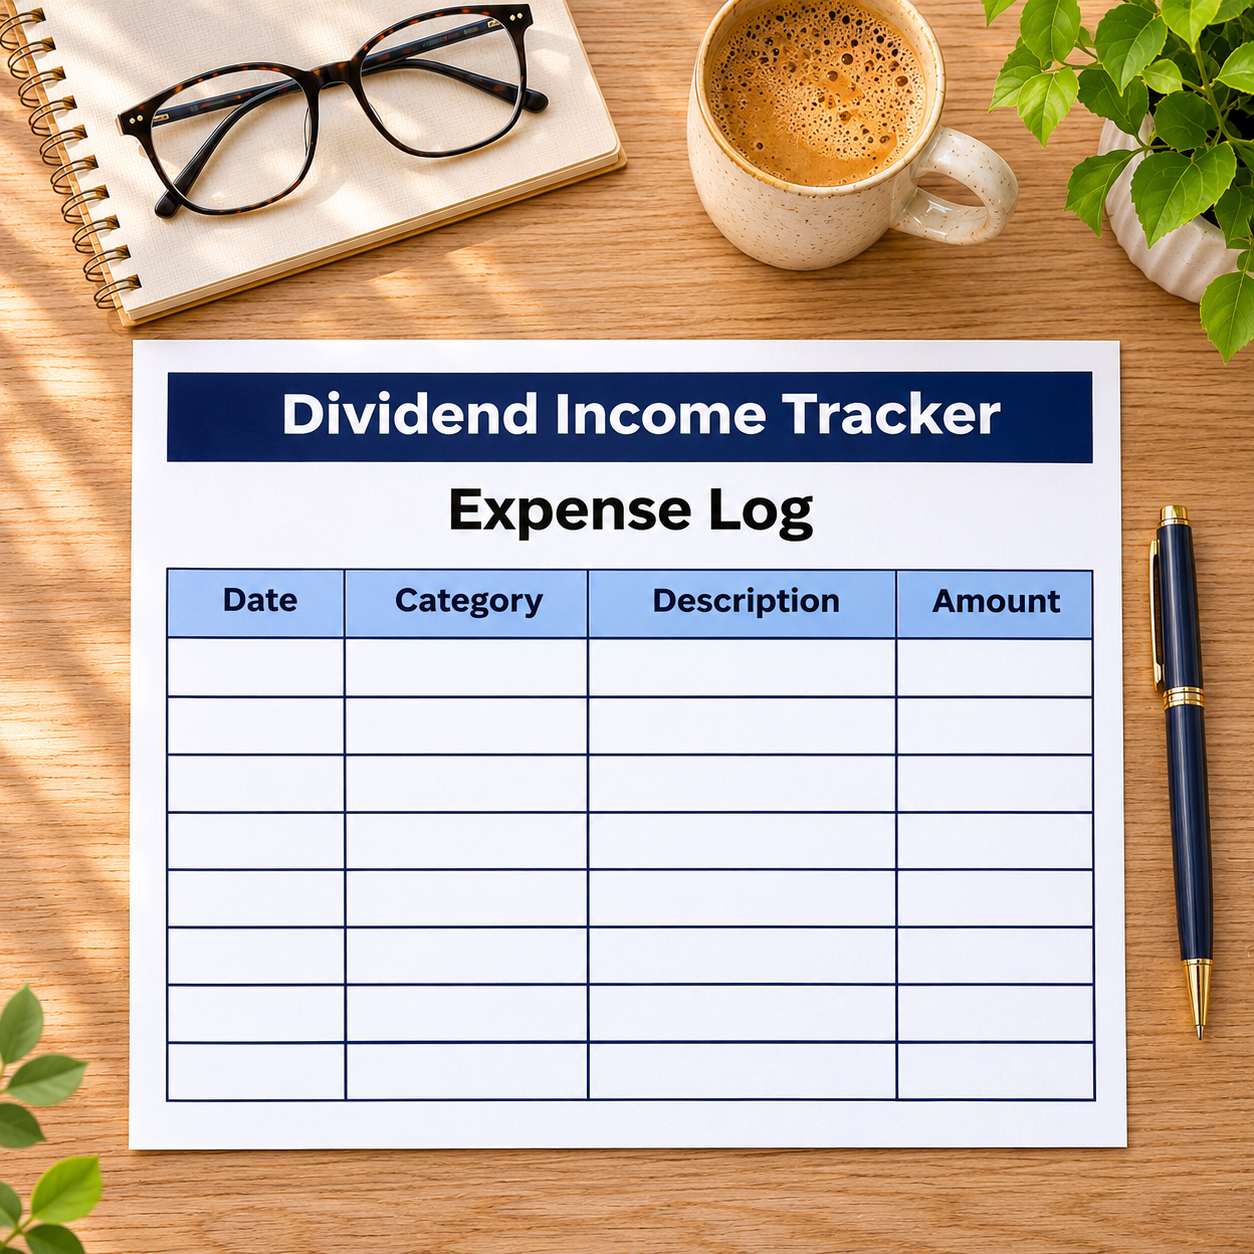
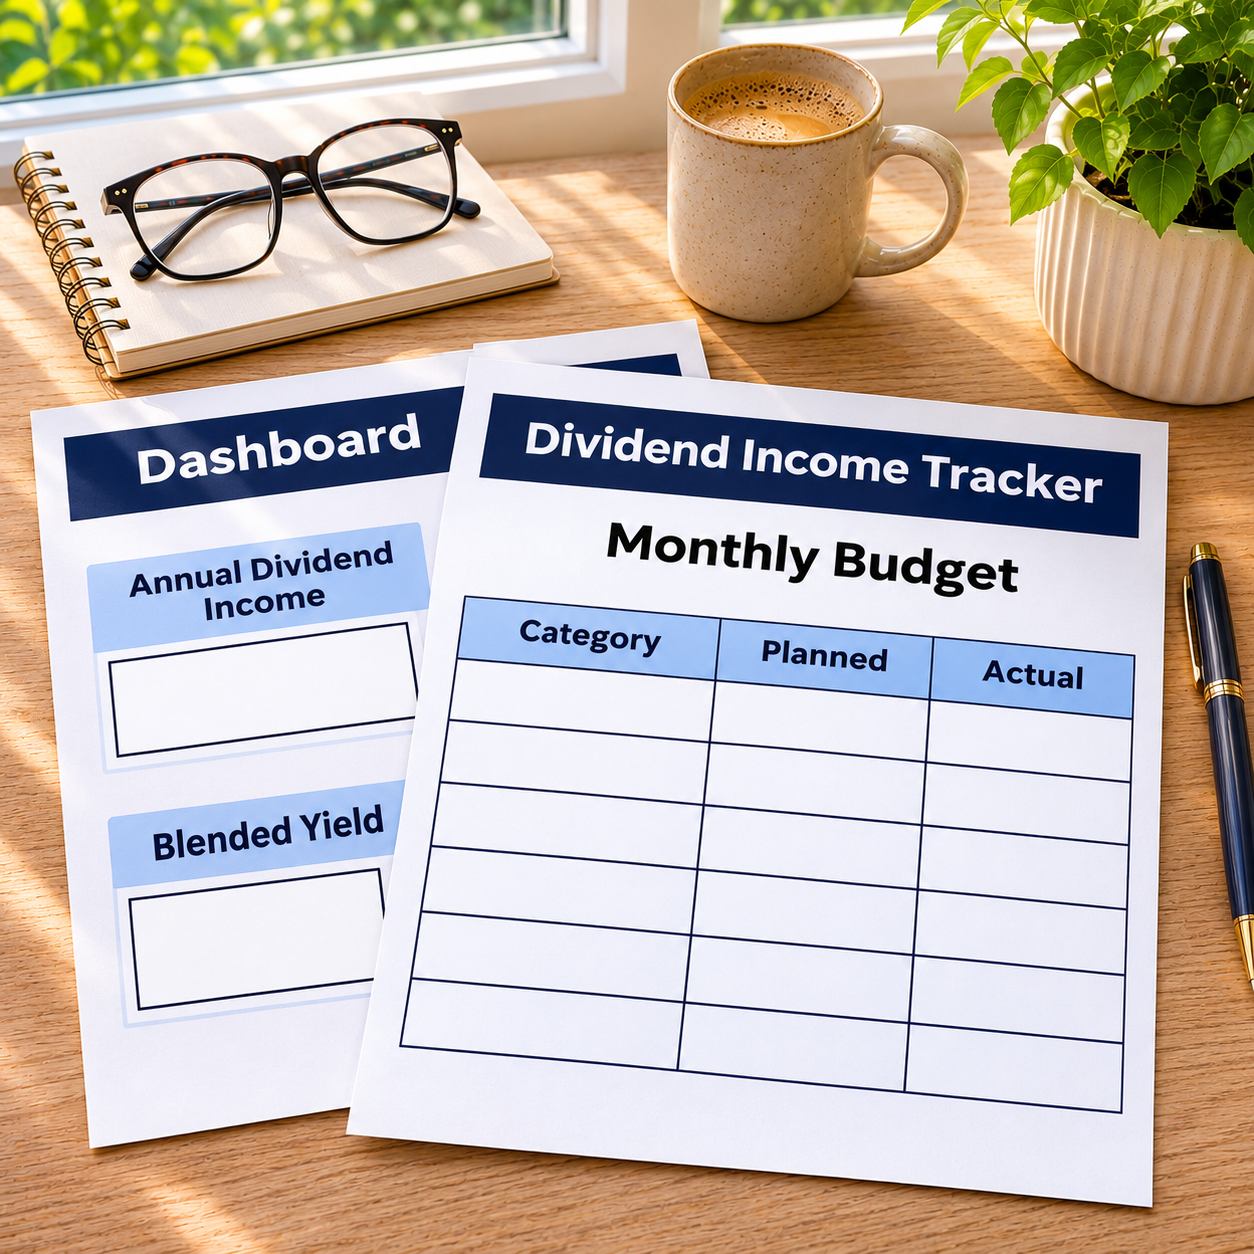
– Adds the DRIP example as a clearly-labelled assumption, plus expense log, budget, dashboard and summary
What’s inside (.xlsx, works in Excel AND Google Sheets):
– Start Here — setup steps and the DRIP example settings (toggle, EXAMPLE growth %, horizon)
– Holdings & Income — 9 sample holdings, both yields, portfolio totals and the income picture
– Payout Calendar — who pays in which month, month totals, and the $0.00 calendar check
– Expense Log, Monthly Budget, Dashboard, Monthly Summary
Instant download. Type only in the yellow cells — formula cells are locked (password: sheetdaily, disclosed on the Start Here tab so you can unlock if you ever need to). Sample portfolio is pre-filled so you can see exactly how it works; clear the yellow cells and type your own. Planning tool only — not investment advice; dividends are set by companies and can be cut, and prices here are whatever you last typed.


Reviews
There are no reviews yet.